
Blog
We’re recruiting: Join the Bucks Data Exchange team
We’re looking for an experienced manager to lead the development of the Bucks Data Exchange.
We’re looking for an experienced manager to lead the development of the Bucks Data Exchange.
The Bucks Data Exchange provided a rare environment to work in a multi-agency partnership, where everyone was invested in collaboration.
The Bucks Data Exchange platform has launched at an event kindly hosted by the Rothschild Foundation.

As a data enthusiast, and manager of the Bucks Data Exchange, it’s remarkable to see how data is at the forefront of so many people’s minds in the VCSE sector.

Thames Valley Police is the largest non-metropolitan police force in England and Wales, encompassing the counties of Berkshire, Oxfordshire and Buckinghamshire. The Office of the

It was during the early months of the Covid-19 pandemic that a sub-group of the Buckinghamshire Voluntary Community and Social Enterprise (VCSE) Recovery Board formed.
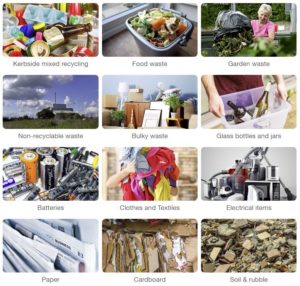
Find out what happens to the waste produced by homes in Buckinghamshire.

Age-standardised mortality rate from cardiovascular disease, cancer and respiratory disease considered preventable in persons aged less than 75 years per 100,000 population.
The basic concept of preventable mortality is that deaths are considered preventable if, in the light of the understanding of the determinants of health at the time of death, all or most deaths from the underlying cause (subject to age limits if appropriate) could mainly be avoided through effective public health and primary prevention interventions.
To ensure that there continues to be a reduction in the rate of premature mortality (deaths to those under 75 years), there needs to be concerted action in both prevention and treatment.
The census takes place every ten years. It gives a picture of all the people and households in England and Wales. The first 2021 Census results, including high-level population figures at the local authority level, were published on 28th June 2022. This section outlines the headline statistics for Buckinghamshire.
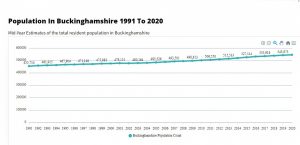
The chart shows the size of the population in Buckinghamshire and how it has changed since 1991 when the current recording methodology began.

Small Charity Week is all about empowering small charities across the UK, including highlighting the challenges they face and the positive impact they make on local communities. 96% of the voluntary organisations in the UK are small charities, with an annual income of less than £1million.
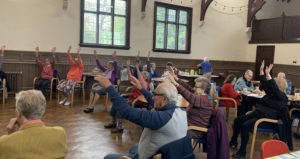
Wednesday Club Waddesdon are a sociable and supportive charity for older people in the North of Aylesbury Vale. They aim to improve mental health and reduce loneliness and isolation.
This dataset platform offers free statistics on …


