Search
Close this search box.

Charity delivery approach

This data shows the different methods of operation that registered charities in Buckinghamshire undertake. Charities can use a range of methods to deliver support to their beneficiaries and this chart does not necessarily reflect all the different types of work that charities do.

This table shows the different methods of operation that registered charities in Buckinghamshire undertake, according to categories set by the Charity Commission. The data reveals that the most common method of operation is to provide buildings, facilities and open spaces with 564 charities in Buckinghamshire doing this. The least common method of operation was for charities to sponsor or undertake research with just 61 charities doing this. It is worth noting that a single charity can operate in many different ways and this table is restricted by the data contained in the Charity Commission database.

This data was collated by Community Impact Bucks for their State of the Sector 2019 report. It used source data from the Charity Commission’s register of charities. Community Impact Bucks published a methodology report explaining how they undertook the analysis and calculated their findings. Community Impact Bucks were able to find classification data for 1,789 Buckinghamshire charities, reflected in the table below. However, there are more charities registered in Buckinghamshire than this,  and more voluntary and community sector organisations who are not registered charities, reflecting gaps in the  dataset.

* The categories in this table reflect the naming conventions used by the Charity Commission.

Related Data
Value of grants given in Buckinghamshire
Charities & Funding

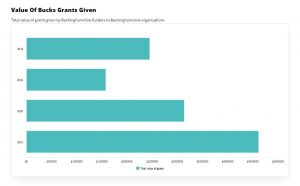
Value of Bucks grants given

This chart contains the total value of grants awarded by some of the key funders in Buckinghamshire, to Buckinghamshire based organisations. It shows how much

Read More »
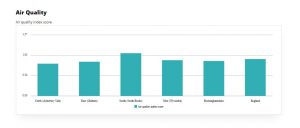
Graph showing the air quality of districts within Buckinghamshire
Data

Air quality

Air quality can be assessed by the concentration of various pollutants in the air. The air quality indicator is compiled from four key air pollutants:

Read More »
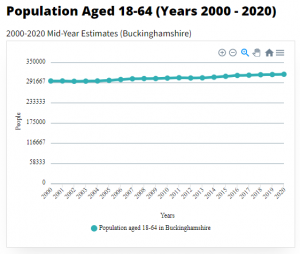
Chart showing Population-Aged-18-64-Buckinghamshire
Data

Population of 18-64 year olds

The data show how the working-age population (aged 18-64) in Buckinghamshire has changed over the last two decades and how it is projected to change

Read More »
Close up of a blue light siren
Community Safety

Shoplifting

This chart shows the number of recorded shoplifting offences in Buckinghamshire. Shoplifting is the action of stealing goods from a shop while pretending to be

Read More »