This chart shows the number of anti-social behaviour incidents recorded in Buckinghamshire each month between 2019 and 2022. The data in the chart shows that there have been higher levels of anti-social behaviour recorded in summer months. This pattern is consistent with patterns nationally.
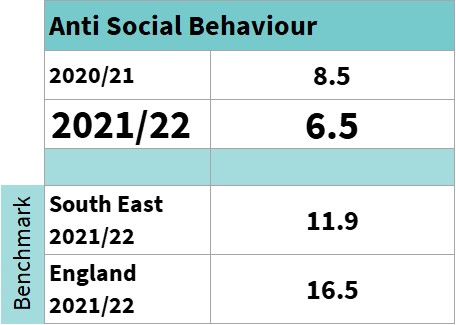
The table shows the anti-social behaviour rates for 2021-22 compared to the previous year, as well as regional and national benchmark rates. The rate is the number of incidents reported per 1,000 households, enabling a meaningful comparison of anti-social behaviour rates in Buckinghamshire with other geographical areas.
The table shows that Buckinghamshire’s anti-social behaviour rate was lower in 2021-22 compared to 2020-21, and is significantly lower than the South East and England.
It is worth noting that whether a person’s actions can be classed as anti-social behaviour relies heavily on the impact it has on other people as well as the type, frequency and intensity of that behaviour.
Anti-Social Behaviour
Monthly Anti-Social Behaviour incidents in Buckinghamshire, 2019-22
No Data Found