Data
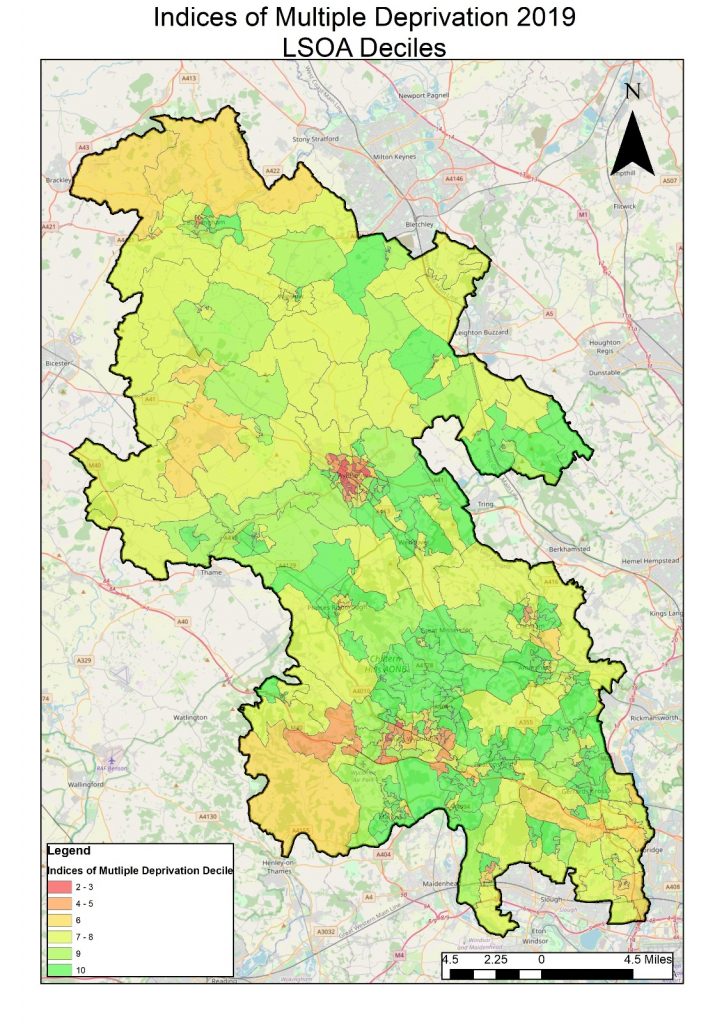
Age distribution
The chart shows the age distribution of children (0-17 year-olds), working-age people (18-64 year-olds) and older people (65+ year-olds) in Buckinghamshire, South East England, and
Data
2021 Census update
The census takes place every ten years. It gives a picture of all the people and households in England and Wales. The first 2021 Census

Data
Unemployment and economic inactivity
Data on the number of Buckinghamshire residents who are unemployment, economically inactive and claiming out-of-work / underemployment related benefits.
Charities & Funding
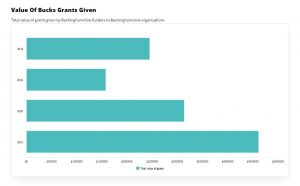
Value of Bucks grants given
This chart contains the total value of grants awarded by some of the key funders in Buckinghamshire, to Buckinghamshire based organisations. It shows how much


