
Data
Population growth
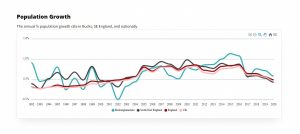
The chart shows how Buckinghamshire’s population has increased (and decreased) year on year. It also shows the growth rate in South East England, England, and
Data
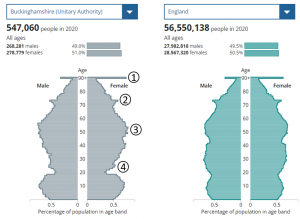
Population pyramid
A population pyramid shows the distribution of age and sex in a population by visualising the proportion of people that fall into each category.

Data
Universal Credit Claimants
Universal Credit supports residents who are on a low income or out of work. It includes a monthly payment to residents with their living costs.

Charities & Funding
Size of Bucks grants given
This data shows the size of grants given by some of the key funders in Buckinghamshire to Buckinghamshire based organisations. It gives an indication of


