In Buckinghamshire in 2021, 79.9% of the population were from a White ethnic background compared to 81.0% in England and 86.3% in South East England. The largest ethnic minority group were Asian, Asian British or Asian Welsh. This group comprised 12.4% of the Buckinghamshire population compared to 9.6% in England and 7.0% in South East England. The county had a higher percentage of people with mixed ethnicity than South East England and England. There was also a higher percentage of Black, Black British, Black Welsh, Caribbean or African people in Buckinghamshire compared to the South East but not compared to England.
Data
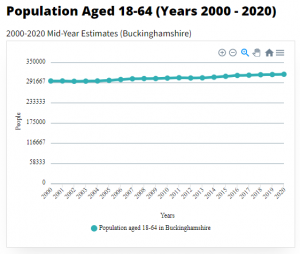
Population of 18-64 year olds
The data show how the working-age population (aged 18-64) in Buckinghamshire has changed over the last two decades and how it is projected to change
Data
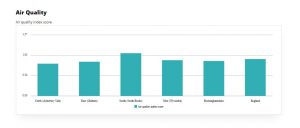
Air quality
Air quality can be assessed by the concentration of various pollutants in the air. The air quality indicator is compiled from four key air pollutants:

Data
Drug treatment
This data shows successful completions as a proportion of all in treatment. A successful completion means a drug user is free of drug dependence.

Data
Unemployment Claimant Count
The Claimant Count counts the number of people claiming Jobseeker’s Allowance plus those who claim Universal Credit and are required to seek work and be


