2021 Census update
The census takes place every ten years. It gives a picture of all the people and households in England and Wales. The first 2021 Census results, including high-level population figures at the local authority level, were published on 28th June 2022. This section outlines the headline statistics for Buckinghamshire.
Population size
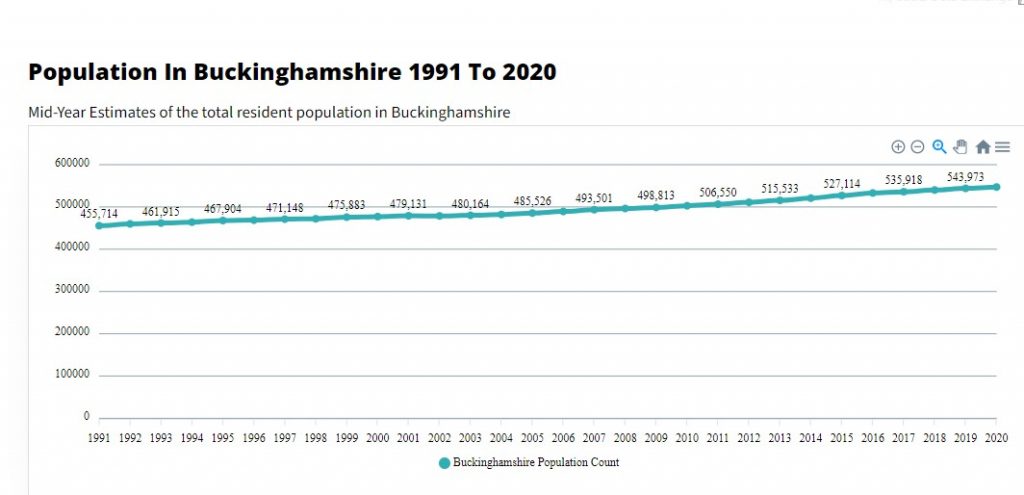
The chart shows the size of the population in Buckinghamshire and how it has changed since 1991 when the current recording methodology began.
Age distribution
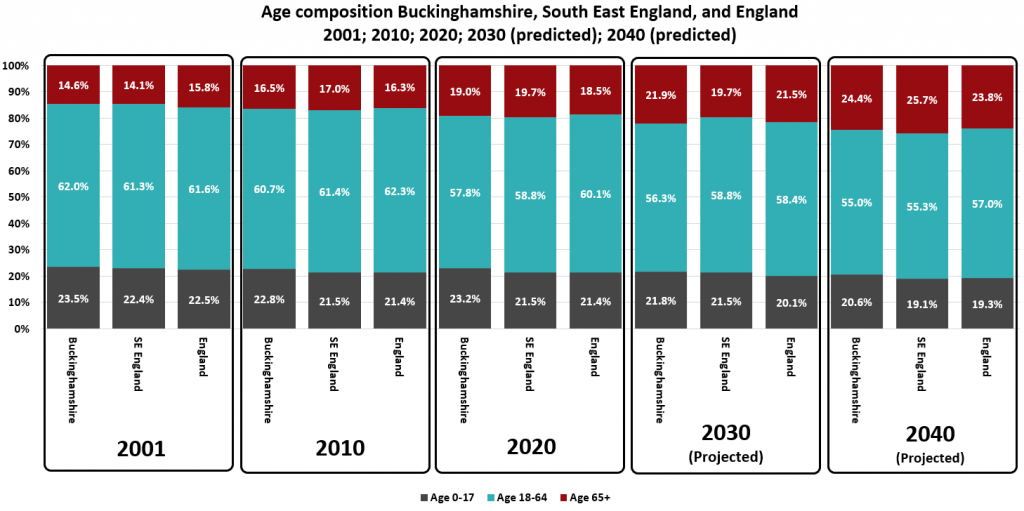
The chart shows the age distribution of children (0-17 year-olds), working-age people (18-64 year-olds) and older people (65+ year-olds) in Buckinghamshire, South East England, and England.
Components of population change
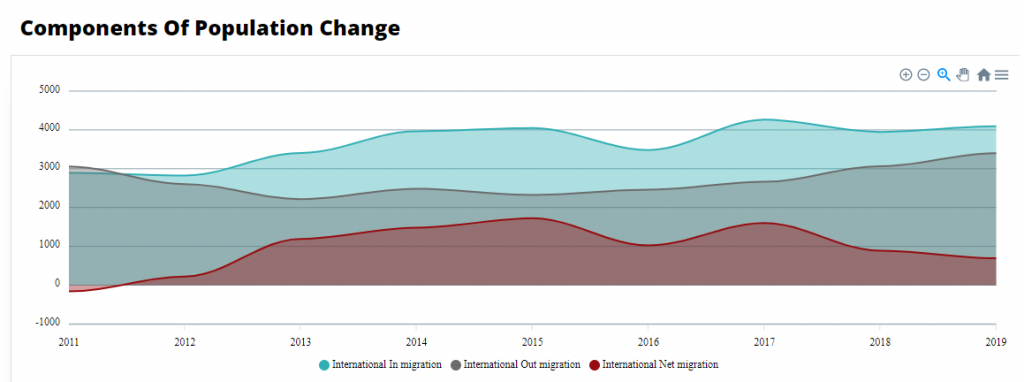
The charts in this section show the components of population change. The components are natural change (births and deaths); internal UK migration (people moving in and out of Buckinghamshire from other parts of the UK), and international migration.
Population pyramid
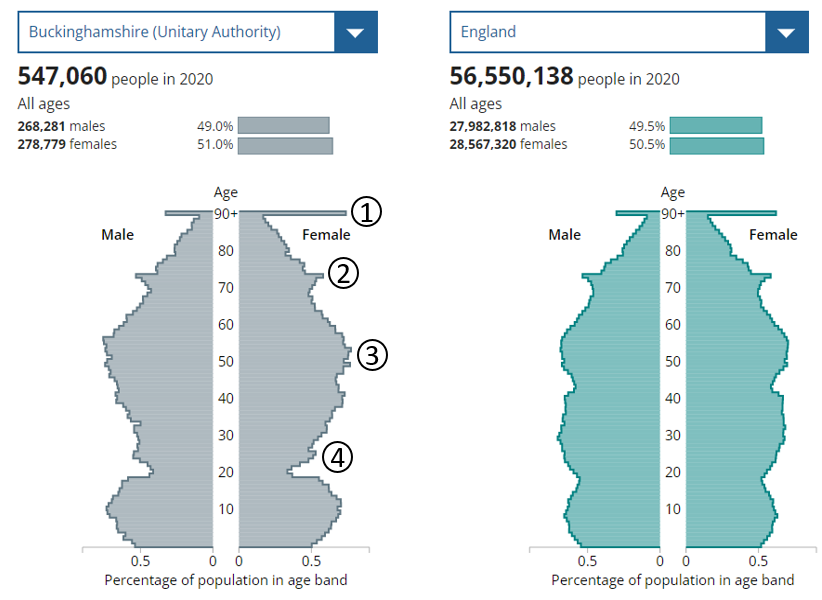
A population pyramid shows the distribution of age and sex in a population by visualising the proportion of people that fall into each category.
Population growth
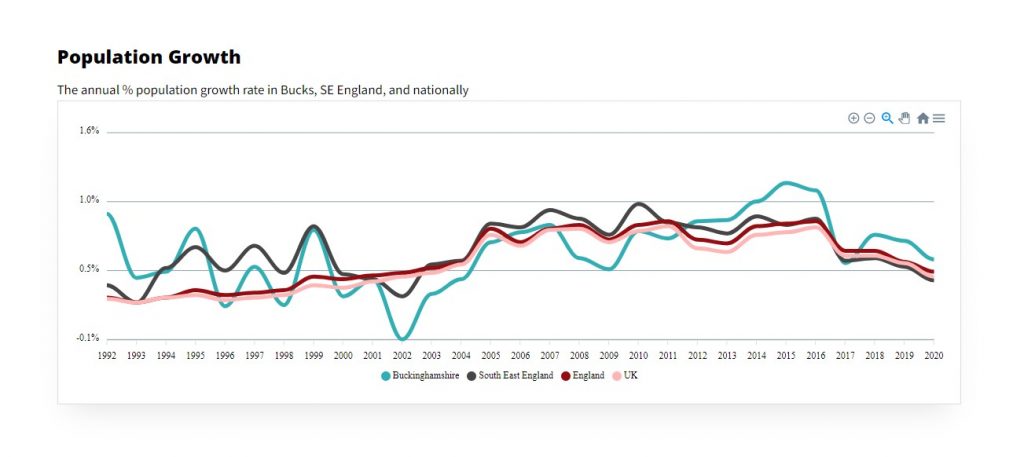
The chart shows how Buckinghamshire’s population has increased (and decreased) year on year. It also shows the growth rate in South East England, England, and the UK.
Joint Strategic Needs Assessment

The Joint Strategic Needs Assessment (JSNA) looks at the current and future health and care needs of Buckinghamshire’s residents to inform health, wellbeing and social care services.
Population of 0-17 year olds
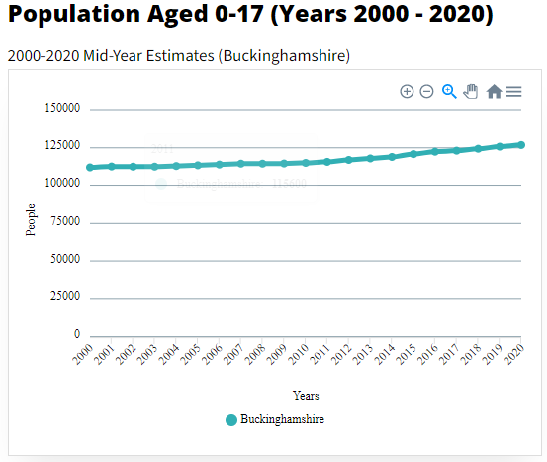
The data show how the population of children (aged 0-17) in Buckinghamshire has increased over the last two decades. The most recent decade between 2010 and 2020 has witnessed the largest increase.
Population of 18-64 year olds
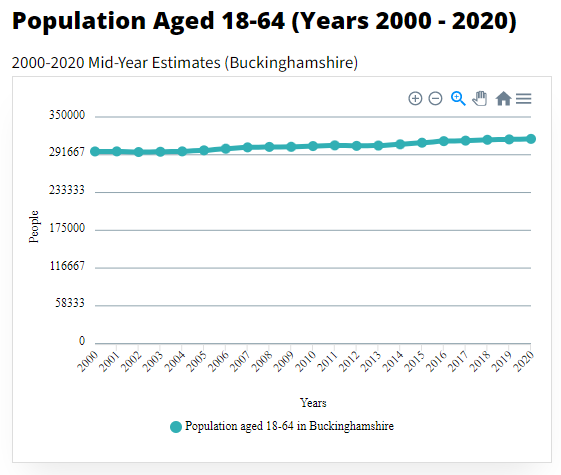
The data show how the working-age population (aged 18-64) in Buckinghamshire has changed over the last two decades and how it is projected to change over the coming two decades to 2040.
Gapminder – animated population data
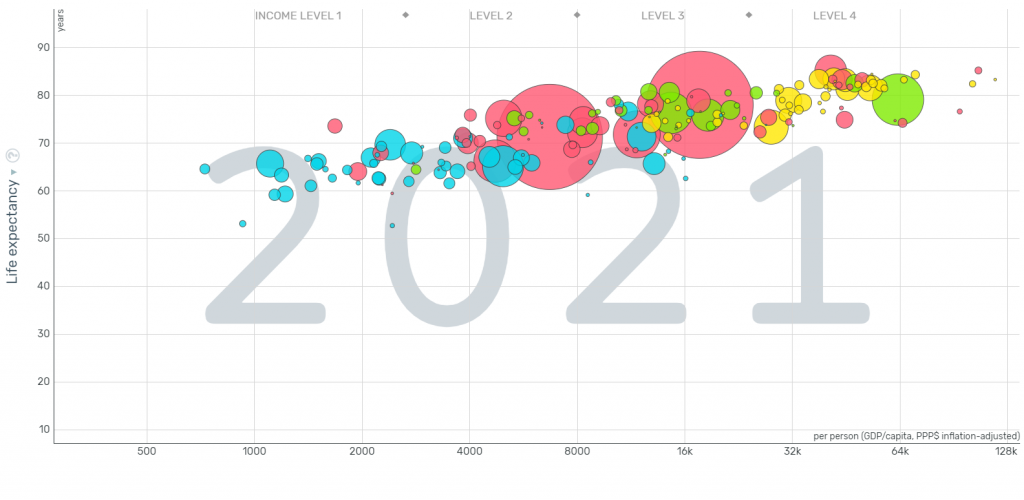
Animated ‘health (life expectancy) and wealth (income levels)’ population chart covering the world.


