Interactive UK population pyramid
Interactive population pyramid
Census
The census is undertaken by the Office for National Statistics every 10 years and gives us a picture of all the people and households in England and Wales.
Estimates of the population for the UK, England and Wales, Scotland and Northern Ireland (includes regions and local authorities).
National and subnational mid-year population estimates for the UK and its constituent countries by administrative area, age and sex.
ONS Sub-National Population Projections (SNPP) for local authorities in England
Population figures over a 25-year period (2018 projected to 2043) for local authorities in England
Analysis of population estimates tool
A downloadable Excel tool for interactive analysis of estimated population change for England and Wales.
Population of 65+ year olds
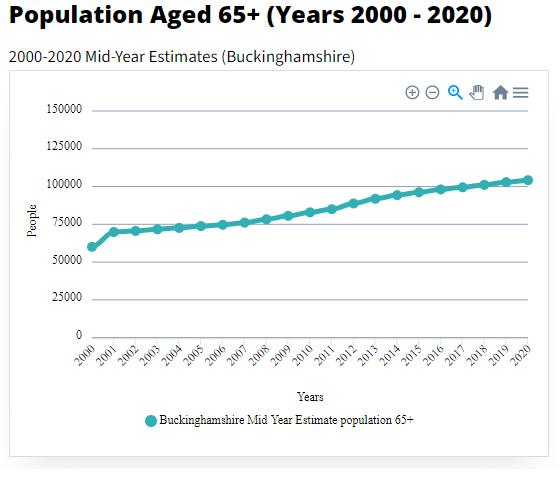
The charts show how the number of residents aged 65+ has increased over the last two decades and how it is predicted to continue to rise over the next two decades.
Old Age Dependency Ratio

The chart shows the historic and projected Old-Age Dependency Ratio (OADR) in Buckinghamshire. The OADR has risen steadily in the last two decades and is projected to continue to rise.
Ethnicity

The data table shows ethnicity in Buckinghamshire from the 2021 Census. The county had a lower proportion of people from a white ethnic background than South East England and England. The county also had a higher proportion of Asian, Asian British or Asian Welsh and Mixed or Multiple ethnic groups than South East England and England.
Community Board Interactive Dashboard
A link to the Council’s interactive Community Board profiles, containing key data on local areas within Buckinghamshire.
Population change in neighbouring areas
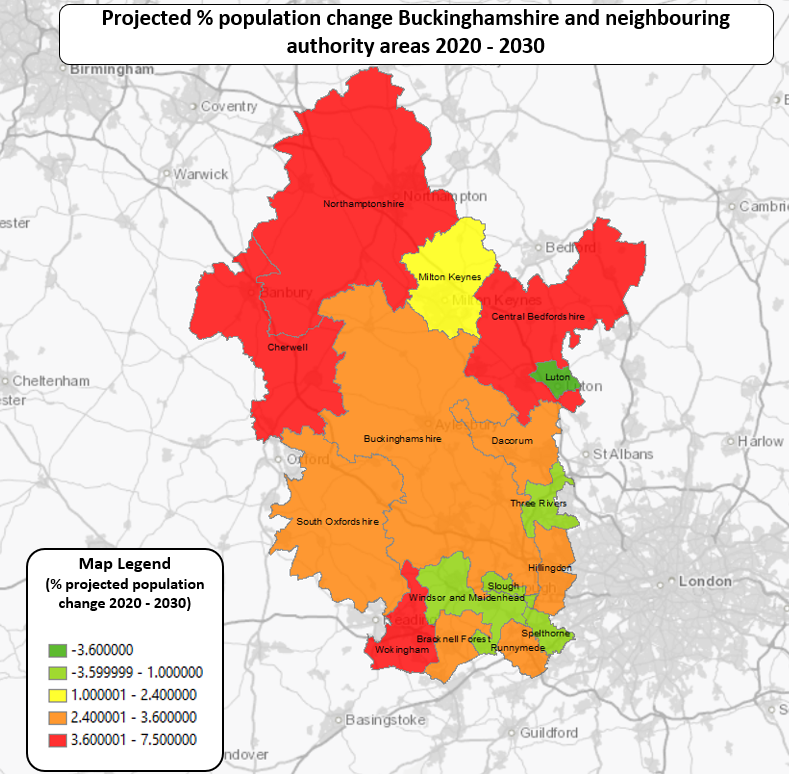
The charts and map show the projected population changes from 2020 to 2030 in the authority areas neighbouring Buckinghamshire.


