2021 Census update

The census takes place every ten years. It gives a picture of all the people and households in England and Wales. The first 2021 Census results, including high-level population figures at the local authority level, were published on 28th June 2022. This section outlines the headline statistics for Buckinghamshire.
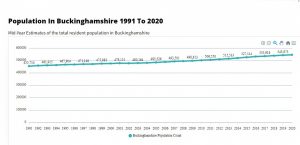
  • The population size in the County has grown from around 505,300 people in 2011 to approximately 553,100 people in 2021. An increase of 9.5 per cent.


  • In 2021, Buckinghamshire ranked fifth for total population out of 309 local authority areas in England, moving up two places in a decade.


  • In England, over the same period (2011 to 2021), the population grew by nearly 3.5 million to 56,489,800, an increase of 6.6 per cent. The growth is 2.9 per cent lower than the increase in Buckinghamshire. 


  • Buckinghamshire’s population increase is also higher than the increase for the South East, which stands at 7.5 per cent.


  • The ONS previously predicted the population in Buckinghamshire in 2021 would be 548,850. Following the release of the Census results, the revised figure stands at 553,100, an increase of 4,250 more people than expected.


  • There were 6.2 per cent more 20-39-year-olds in Buckinghamshire in 2021 than previously estimated by the ONS. However, there were 3.3 per cent fewer 0-14-year-olds than previously estimated. 


  • Nearby areas like Central Bedfordshire and Milton Keynes have seen their populations increase too. Central Bedfordshire’s population has grown by around 15.7 per cent, and Milton Keynes’s population by 15.3 per cent.
Image of the 2021 Census Logo
Related Data
Thumbnail of Buckinghamshire Population
Data

Population size

The chart shows the size of the population in Buckinghamshire and how it has changed since 1991 when the current recording methodology began.

Read More »
Population Age Composition
Data

Age distribution

The chart shows the age distribution of children (0-17 year-olds), working-age people (18-64 year-olds) and older people (65+ year-olds) in Buckinghamshire, South East England, and

Read More »
Data

Components of population change

The charts in this section show the components of population change. The components are natural change (births and deaths); internal UK migration (people moving in

Read More »
Data

Population pyramid

A population pyramid shows the distribution of age and sex in a population by visualising the proportion of people that fall into each category.

Read More »
All Data