Unemployment Claimant Count

The Claimant Count counts the number of people claiming Jobseeker’s Allowance plus those who claim Universal Credit and are required to seek work and be available for work. It is a measure of the number of people claiming ‘out-of-work’ related benefits. Not all those who are unemployed claim benefits. This is largely due to people finding new work very quickly or having other sources of financial support at home. In addition, not all those counted within the Claimant Count are unemployed (some are working a low number of hours and/or are earning a low income). Whilst the Claimant Count is not a measure of unemployment, it is a useful proxy at the local level.
Greenhouse Gas Emissions

The Department for Energy Security and Net Zero publish national statistics on UK local authority and regional gas emissions. The greenhouse gases covered by these statistics are carbon dioxide, methane and nitrous oxide. In accordance with international reporting and carbon trading protocols, each of these gases is weighted by its global warming potential (GWP), so that total greenhouse gas emissions can be reported on a consistent basis (in carbon dioxide equivalent units). The GWP for each gas is defined as its warming influence relative to that of carbon dioxide. The GWPs used in these statistics are from Working Group 1 of the IPCC Fifth Assessment Report: Climate Change 2013.
Broadband Speed

Broadband provides access to internet services such as videoconferencing for work, tele-healthcare, access to job or property advertisements, and e-commerce. It is fast becoming an essential utility alongside water, gas and electric in UK homes. From March 2018, the Government set a legal minimum service obligation (LSO) of 10 megabytes per second (Mbps). Ofcom research shows that 10 Mbps is the minimum speed currently needed to meet an average household’s digital needs. It should be fast enough for multiple people in a household to be online at once.
Recycling

Recycling Rate data is the percentage of household waste sent for reuse, recycling or composting. It is derived from WasteDataFlow (web-based-system for municipal waste reporting by UK local authorities to Government). The WasteDataFlow system went live on 30 April 2004.
Workforce profile
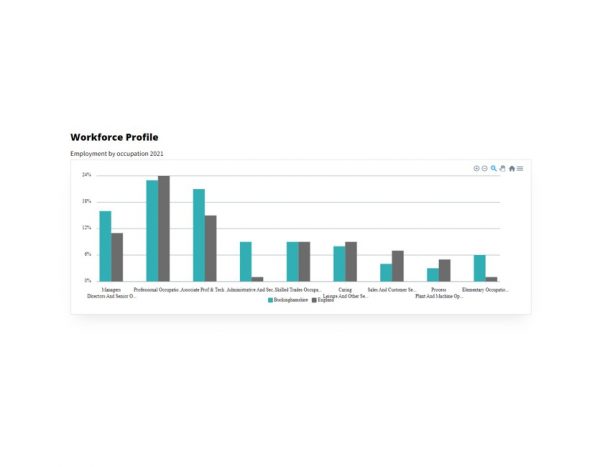
This chart shows how the broad occupational profile of Buckinghamshire’s residents compares with the occupational profile of England as a whole.
Early deaths

Age-standardised mortality rate from cardiovascular disease, cancer and respiratory disease considered preventable in persons aged less than 75 years per 100,000 population.
The basic concept of preventable mortality is that deaths are considered preventable if, in the light of the understanding of the determinants of health at the time of death, all or most deaths from the underlying cause (subject to age limits if appropriate) could mainly be avoided through effective public health and primary prevention interventions.
To ensure that there continues to be a reduction in the rate of premature mortality (deaths to those under 75 years), there needs to be concerted action in both prevention and treatment.
2021 Census update
The census takes place every ten years. It gives a picture of all the people and households in England and Wales. The first 2021 Census results, including high-level population figures at the local authority level, were published on 28th June 2022. This section outlines the headline statistics for Buckinghamshire.
Population size
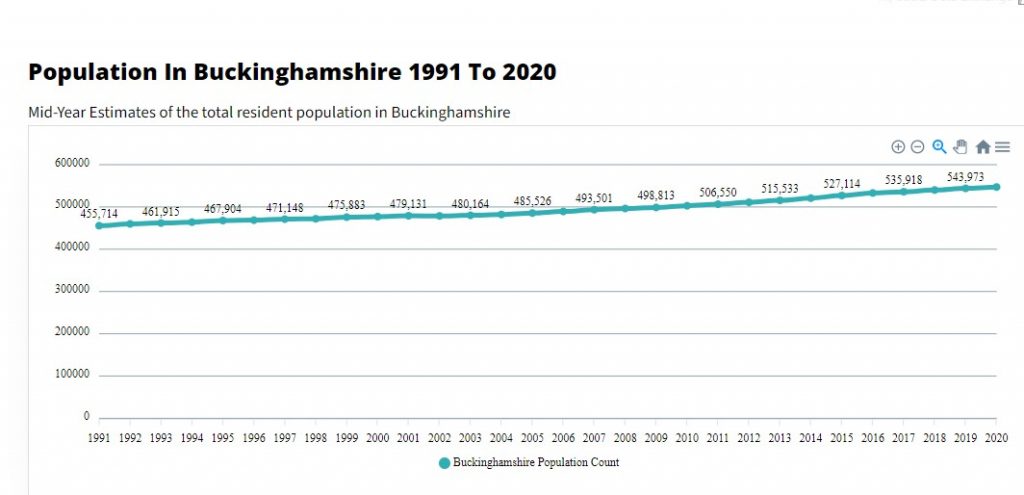
The chart shows the size of the population in Buckinghamshire and how it has changed since 1991 when the current recording methodology began.
Age distribution
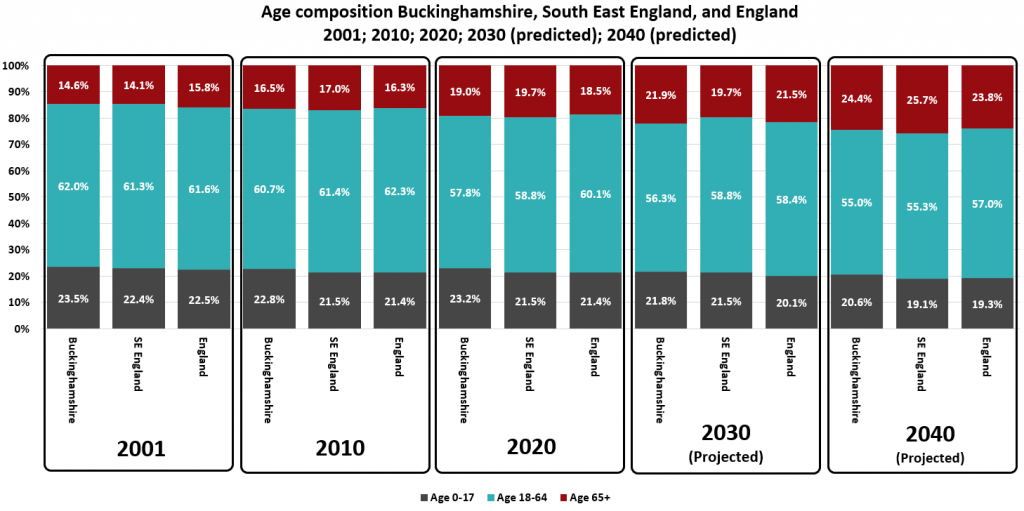
The chart shows the age distribution of children (0-17 year-olds), working-age people (18-64 year-olds) and older people (65+ year-olds) in Buckinghamshire, South East England, and England.
Components of population change
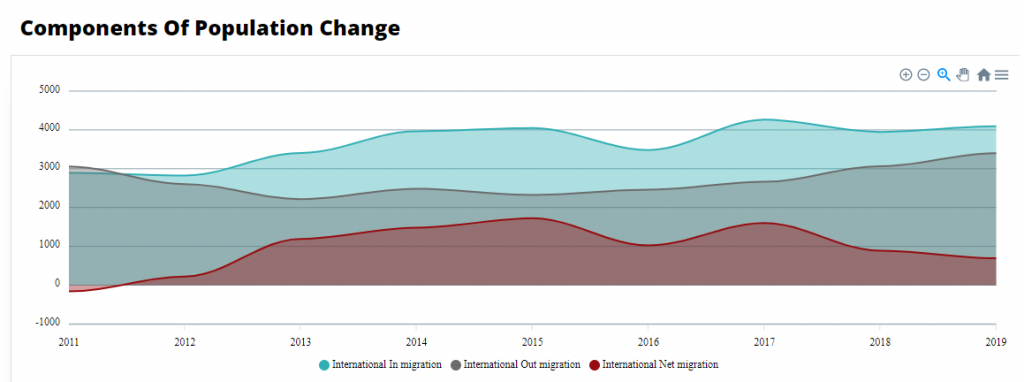
The charts in this section show the components of population change. The components are natural change (births and deaths); internal UK migration (people moving in and out of Buckinghamshire from other parts of the UK), and international migration.


