Population of 0-17 year olds

The data show how the population of children (aged 0-17) in Buckinghamshire has increased over the last two decades. The most recent decade between 2010 and 2020 has witnessed the largest increase.

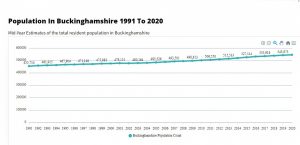
The chart shows the count of citizens aged 0-17 at the mid-year point in Buckinghamshire from the year 2000 until 2020. It then projects the population of children from 2021 until 2040 using the latest ONS data. The number of children in the county has risen by 15,000 since the turn of the millennium (111,900 in 2000 to 126,900 in 2020). The sharpest increase has occurred in the most recent decade with 10.4% more children in the county by 2020 than in 2010 (approx. 12,000 extra children).  

According to the latest ONS projections the number of children in the county is set to continue to increase until 2025 and will then start to gently fall. By 2030 it is projected that the number of children in the county will be back to levels seen in 2017. Looking further ahead the population of children between the years 2030 to 2040 is projected to stay relatively consistent at around the 118,000 – 120,000 range. 

Population aged 0-17 (years 2000 - 2020)

2000-2020 Mid-Year Estimates (Buckinghamshire)

No Data Found

Population Aged 0-17 (years 2021 - 2040)

2021-2040 projected population (Buckinghamshire)

No Data Found

Related Data
Image of the 2021 Census Logo
Data

2021 Census update

The census takes place every ten years. It gives a picture of all the people and households in England and Wales. The first 2021 Census

Read More »
Thumbnail of Buckinghamshire Population
Data

Population size

The chart shows the size of the population in Buckinghamshire and how it has changed since 1991 when the current recording methodology began.

Read More »
Population Age Composition
Data

Age distribution

The chart shows the age distribution of children (0-17 year-olds), working-age people (18-64 year-olds) and older people (65+ year-olds) in Buckinghamshire, South East England, and

Read More »
Data

Components of population change

The charts in this section show the components of population change. The components are natural change (births and deaths); internal UK migration (people moving in

Read More »
All Data