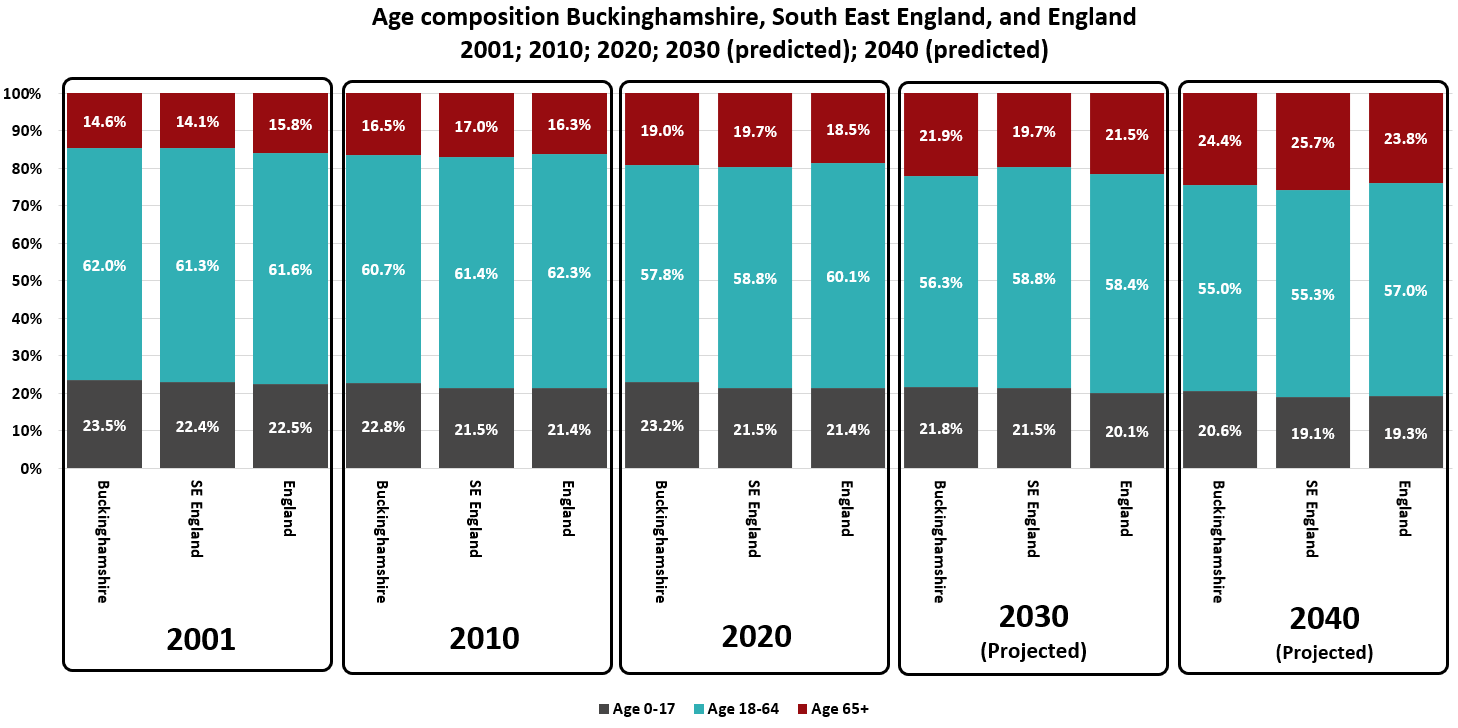
The terms ‘age composition’ and ‘age distribution’ are used interchangeably in population studies but mean the same thing; the statistical grouping of people to help understand the age structure of a given population.
Age distributions can differ among local authority areas, regions and countries mainly because of differences in the levels and trends of fertility, lifestyle, and access to good quality housing and healthcare. In Buckinghamshire, the working-age (18–64-year-old) proportion of the population is getting squeezed by an increasing cohort of older citizens.
The chart below has five sections, and each section shows data for the start of a new decade (note that 2001 is the first year the current recording methodology began). The period 2001 through 2020 uses ONS mid-year estimate data, and the period 2020 to 2040 uses ONS projected population data, i.e. the data from 2020 onward represent the modelled future age composition using the best available information from the ONS.
In 2001 62.0% of the population in Buckinghamshire were classed as working age (18-64) and 14.6% of the population were older citizens aged 65+. Just under two decades later, by 2020, the working-age population represents 57.8% and citizens aged 65+ had jumped to 19%.
By 2040 it is projected that 55% of the people in Buckinghamshire will be of working age, and 24.4% will be 65+. The relative squeeze of the proportion of working-age citizens to younger and older citizens is a trend seen in Buckinghamshire, South East England (which excludes London), and England.