Unemployment
The official definition of unemployment is ‘people without a job, who have been actively seeking work in the past four weeks and are available to start work.’
The most accurate unemployment data for Buckinghamshire is produced by the Office for National Statistics (ONS) using a combination of data from the Annual Population Survey and data on those claiming unemployment and underemployment* related benefits.
Buckinghamshire had an estimated unemployment rate (the number of people who are unemployed as a proportion of the economically active population aged 16+) of 3.0% in the 12 months to March 2024. This was lower than the national average of 3.9%, and lower than the South East average of 3.2%.
Unemployment rate
Number of people who are unemployed as a proportion of the economically active population aged 16+
No Data Found
*In this context, underemployment refers to those working a low number of hours who could work more.
Economic inactivity
People aged 16 and over without a job, who have not sought work in the last four weeks and/or are not available to start work as classified as being economically inactive.
The main economically inactive groups are students, people looking after family and home, long-term sick and disabled, temporarily sick and disabled, retired people and discouraged workers.
According to the Annual Population Survey, Buckinghamshire’s economic inactivity rate (the number of people who are economically inactive as a proportion of all residents aged 16+) stood at 32.2% in the 12 months to March 2024. This was lower than the national average of 36.4%, and lower than the South East average of 34.3%.
Economic inactivity rate
Number of people who are economically inactive as a proportion of all residents aged 16+
No Data Found
Claimant Count
The Claimant Count comprises the number of people claiming Universal Credit who are required to seek work and be available for work, plus those claiming Jobseeker’s Allowance. The majority of those in the Claimant Count are unemployed, however a sizable and increasing minority are working (low hours / low wages).
Not all those who are unemployed claim benefits. This is largely due to people finding new work quickly or having other sources of financial support at home.
Buckinghamshire’s claimant rate (claimants as a proportion of all residents aged 16-64) in April 2024 stood at 2.7%, lower than the national average of 3.9%, and lower than the South East average of 3.0%.
Claimants as a proportion of all Buckinghamshire residents aged 16-64
(April 2024)
2.7%
Claimant rate
Claimants as a proportion of all residents aged 16-64 in Buckinghamshire, South East and England (April 2024).
No Data Found
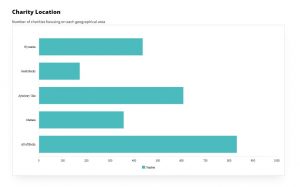
Looking within Buckinghamshire, the claimant count rate is highest in the Booker, Cressex and Castlefield ward at 8.5% and lowest in Ridgeway East at 1.5%.
Ward claimant rates
Claimants as a proportion of all residents aged 16-64 in Buckinghamshire wards (April 2024)
No Data Found
Data on the Buckinghamshire labour market have been sourced from Nomis, a service provided by the Office for National Statistics.
A guide to labour market statistics and definitions can be found on the Office for National Statistics website.
For more local labour market intelligence, including a interactive claimant count dashboard, please visit Buckinghamshire’s Economic Intelligence Observatory.