Unemployment Claimant Count

The Claimant Count counts the number of people claiming Jobseeker’s Allowance plus those who claim Universal Credit and are required to seek work and be available for work. It is a measure of the number of people claiming ‘out-of-work’ related benefits. Not all those who are unemployed claim benefits. This is largely due to people finding new work very quickly or having other sources of financial support at home. In addition, not all those counted within the Claimant Count are unemployed (some are working a low number of hours and/or are earning a low income). Whilst the Claimant Count is not a measure of unemployment, it is a useful proxy at the local level.
Workforce profile
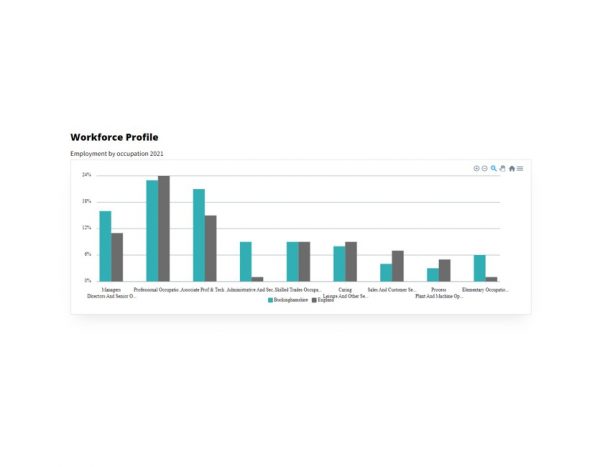
This chart shows how the broad occupational profile of Buckinghamshire’s residents compares with the occupational profile of England as a whole.
Top job postings

Tables showing top occupations by number of job postings for 2022 in Buckinghamshire, the South East and England.
Skills & Qualification Standards
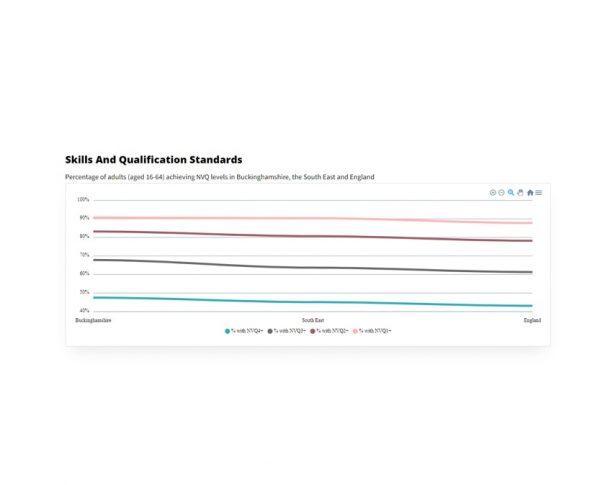
Table showing the proportion of working age (16-64) residents by the highest level qualification they have in Buckinghamshire, South East and England.
Annual earnings
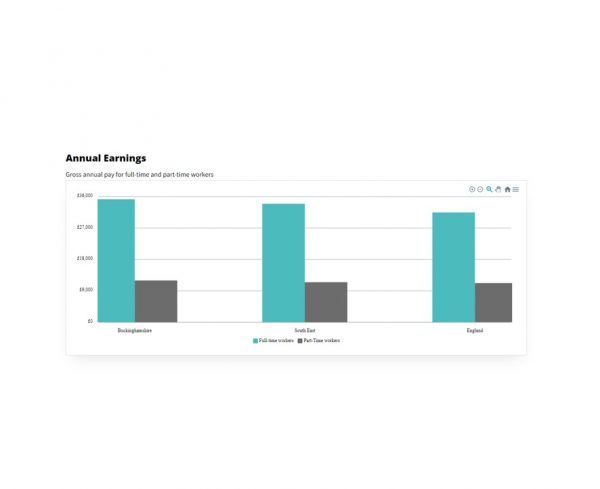
The graph shows the median gross annual pay for residents working full-time and part-time in Buckinghamshire, South East, and England.


