The population of all authority areas that neighbour (or are very close to) Buckinghamshire are predicted to increase from 2020 to 2030. The only exception is Luton where the population is projected to decline by 4% (7,740 fewer people) by 2030.
It is predicted that the fastest growing neighbouring area will be Northamptonshire*, with a projected 8% growth in population equating to 57,000 more people by 2030.
Count of population change predicted by the ONS between 2020 - 2030
Buckinghamshire and neighbouring authority areas (data ordered highest to lowest)
No Data Found
Percentage population change predicted by the ONS between 2020 - 2030
Buckinghamshire and neighbouring authority areas (data ordered highest to lowest)
No Data Found
Map showing predicted population change
It is predicted that there will be 148,500 more people in the area shown on the map below by 2030. The local authority areas shaded red are projected to have the biggest increases whereas the areas shaded green will have the lowest increases or a decline (Luton).
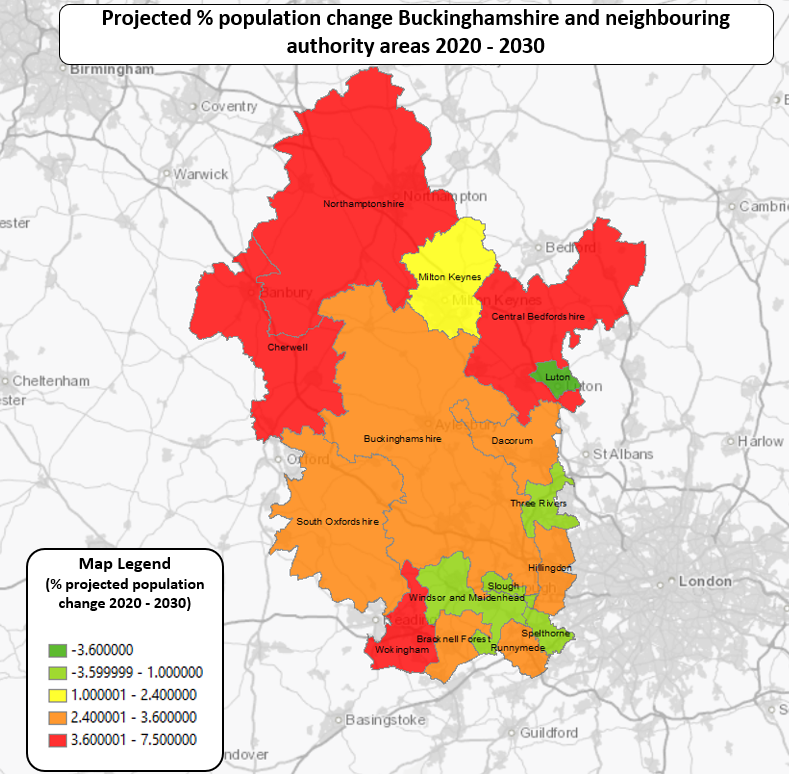
*Northamptonshire is now divided into two Unitary authorities West Northamptonshire and North Northamptonshire. The data provided by the ONS still classifies the area as a single county authority. The ONS are expecting to refresh the data in late 2022.