Search
Close this search box.

Number of Bucks grants given

This chart shows the total number of grants given by some of the key charitable funders in Buckinghamshire to Buckinghamshire based organisations. It gives an indication of how active these grant makers are and how many different projects they have supported over the past few years.

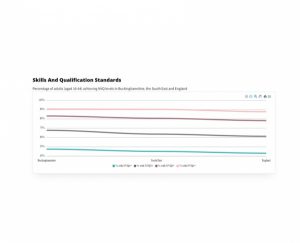
This chart shows the number of individual grants given in Buckinghamshire by the following funders – the Rothschild Foundation, Heart of Bucks, Leap, Fairhive (formerly VAHT), Red Kite and the Clare Foundation from 2018 to 2021. Whether grants were given to individuals or charitable organisations depends on the funder and the funding programme, and there are other charitable funders in Buckinghamshire who have not contributed data, so this graph is only a partial view of grants given by funders in the county.

The chart shows that the number of grants awarded dramatically increased from 2018, when 366 grants were awarded, to 2020, when 780 grants were awarded.


More than double the number of grants were awarded in 2020 and 2021, compared to 2018 and 2019.

Number of Bucks grants given

Number of grants given by Buckinghamshire funders to Buckinghamshire organisations

No Data Found

Related Data
Adult holding an umbrella over a child in a storm
Charities & Funding

Charity beneficiaries

This chart shows the groups of people that charities in Buckinghamshire seek to support. Charities can benefit many different groups of people and this chart

Read More »
Chart showing workforce profile in Buckinghamshire
Data

Workforce profile

This chart shows how the broad occupational profile of Buckinghamshire’s residents compares with the occupational profile of England as a whole.

Read More »
Screenshot of code and data
Data

Broadband Speed

Broadband provides access to internet services such as videoconferencing for work, tele-healthcare, access to job or property advertisements, and e-commerce. It is fast becoming an

Read More »
Population density map of Buckinghamshire
Data

Population density

The choropleth (shaded) map shows population density in the county by census output areas. The red and orange areas have a high density of people

Read More »