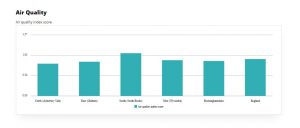
Population density

The choropleth (shaded) map shows population density in the county by census output areas. The red and orange areas have a high density of people per square kilometre. The green areas are sparsely populated with the lowest density of people per square kilometre.

The south of the county of Buckinghamshire has a higher population density than the north. The settlements of Chesham, Amersham, Gerrards Cross, Beaconsfield, High Wycombe, and Marlow contribute to a greater number of people per square kilometre. The north of the county is more rural with a higher proportion of farmland and fewer large settlements. 

The maps below show population densities using Census output area boundaries which are the smallest and most detailed boundary data that the Office of National Statistics (ONS) provide. 

Population density map of Buckinghamshire

These two maps show which areas in Buckinghamshire have the highest densities of people (more than 5,000 per square kilometre) and the lowest densities (less than 200 people per square kilometre). 

The maps illustrate how urban settlements have areas of high-density housing whereas large swathes of rural areas in Buckinghamshire have relatively few dwellings and people. 

Highest and Lowest population Densities map of Bucks
Related Data
Image of the 2021 Census Logo
Data

2021 Census update

The census takes place every ten years. It gives a picture of all the people and households in England and Wales. The first 2021 Census

Read More »
Thumbnail of Buckinghamshire Population
Data

Population size

The chart shows the size of the population in Buckinghamshire and how it has changed since 1991 when the current recording methodology began.

Read More »
Population Age Composition
Data

Age distribution

The chart shows the age distribution of children (0-17 year-olds), working-age people (18-64 year-olds) and older people (65+ year-olds) in Buckinghamshire, South East England, and

Read More »
Data

Components of population change

The charts in this section show the components of population change. The components are natural change (births and deaths); internal UK migration (people moving in

Read More »
All Data