

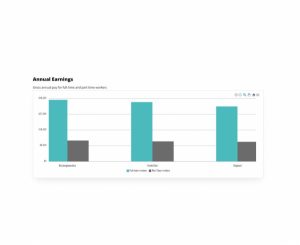
The graph shows the median gross annual pay for residents working full-time and part-time in Buckinghamshire, the South East, and England.

This data shows the percentage of mothers who are known to be smokers when they give birth. The data shown is a percentage of all
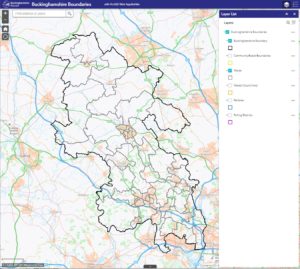
A boundary map is a map created for the purpose of outlining a boundary for an area and the areas next to it.

This chart shows the number of recorded vehicle crimes in Buckinghamshire. Vehicle crime includes the theft of a vehicle, theft from a vehicle and damage


