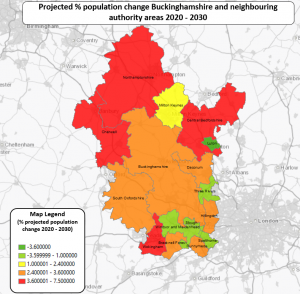
The Office of National Statistics (ONS) release population data each year called mid-year estimates. Mid-year population estimates are the official source of population sizes between censuses, covering populations of local authorities, counties, regions, and countries of the UK by age and sex. The estimates use the census definition of people who are “usually resident” in the UK for 12 months, excluding short-term migrants and counting students at their term-time addresses.
The chart below shows how the total population has changed in Buckinghamshire since 1991, when the current recording methodology began. In 2020 there were around 91,300 more people in the county than in 1991, which is a 20% increase. It took approximately two decades, from 1991 to 2011, for the population to increase by about 50,000 citizens. It then took just under one decade, from 2011 to 2020, for it to increase by approximately 40,000 citizens.
Population in Buckinghamshire 1991 to 2020
Mid-Year Estimates of the total resident population in Buckinghamshire
No Data Found


