Member Spotlight – Leona Forsyth, Senior Grants Manager at the Rothschild Foundation

We hear from Leona Forsyth, Senior Grants Manager, at the Rothschild Foundation to hear more about how she uses data in her role and what motivates her to be involved in the BDEX.
Understanding economic challenges in Buckinghamshire: Census data highlights disparities.
This blog from James Moorhouse, Senior Research and Data Analyst at the Buckinghamshire Local Enterprise Partnership explains how recently released Census data has helped to uncover key differences in the labour market participation of residents and barriers to employment, across Buckinghamshire wards experiencing significant hardship.
Member Spotlight: James Moorhouse, Senior Research & Policy Analyst at Buckinghamshire Local Enterprise Partnership

We caught up with James Moorhouse, Senior Research and Policy Analyst at Buckinghamshire Local Enterprise Partnership to to hear about how he uses data in his role and what motivates him to be involved in the Bucks Data Exchange.
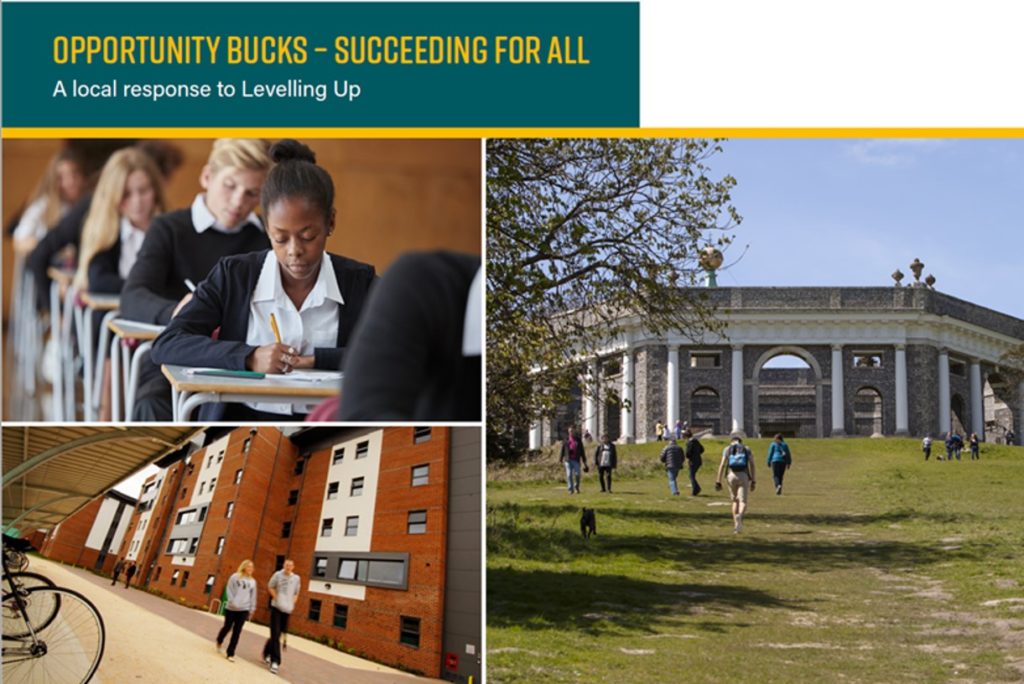
Buckinghamshire Economic Report 2024
This report provides comprehensive analysis of the performance, size and structure of the Buckinghamshire economy. It is essential reading for all those who wish to understand the current state of Buckinghamshire’s economy at a macro-level, and potential opportunities for future growth.
Buckinghamshire Uncovered: Air Quality and the Environment
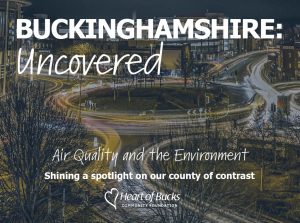
The environment plays a significant role in our lives and has a direct impact on other important areas such as public health. The quality of air is an integral part of our wider environment and ecosystems, as well as affecting our own personal wellbeing. Find out more about the air quality in Buckinghamshire and actions being taken to improve our environment in our latest report.
Now Live – Wave 5 of the national VCSE Barometer Survey! A message from Professor Daniel King, Director of the VCSE Data and Insights National Observatory

Professor Daniel King tells us more about the VCSE National Barometer Survey and how the insights are used to inform policy
Charity Digital Skills Report 2023
The Charity Digital Skills Report is the annual barometer of charities’ digital skills, attitudes and behaviours.
Member Spotlight: Business Intelligence Business Partner, Dr Nadia Al-Sabouni, Buckinghamshire Council
We caught up with Business Intelligence Business Partner Dr Nadia Al-Sabouni to hear about how she uses data in her role and why she is so passionate about working with the Bucks Data Exchange.
Member Spotlight: Strategic Analyst, Aaron Cheung, Thames Valley’s Office of the Police and Crime Commissioner

We caught up with Strategic Analyst, Aaron Cheung who works for Thames Valley’s Office of the Police and Crime Commissioner to hear about how he uses data in his role and why he is so passionate about working with data.
How can charities use data?
Charities collect a lot of information every day – and analysing this data can transform their services for the better. But where should you start? What do we mean by data and data science, and how can you tell if your organisation would benefit from using it?


