Workforce profile
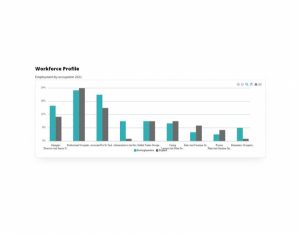
This chart shows how the broad occupational profile of Buckinghamshire’s residents compares with the occupational profile of England as a whole.

This chart shows how the broad occupational profile of Buckinghamshire’s residents compares with the occupational profile of England as a whole.
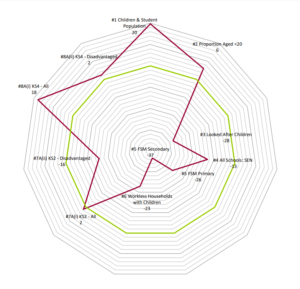
This report from Artswork contains deprivation and achievement data for children and young people at both Local Authority and ward levels, against averages across the South East.
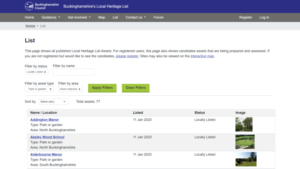
This website, developed by Buckinghamshire Council, contains a list of the historical building sites and structures in the county.
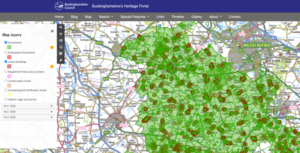
This portal from Buckinghamshire Council allows people to find information about the historical sites in the county.
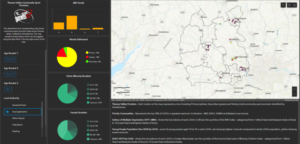
This interactive dashboard allows users to explore where community sports provision is located in Bucks.
In this article the Office for National Statistics considers how life has changed for people living in Buckinghamshire between 2011 and 2021.
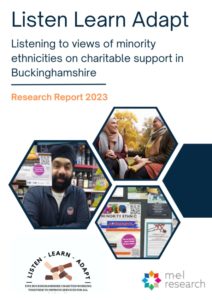
This report explores the views of minority ethnic communities in Buckinghamshire about how support services offered by local charities can be more inclusive and welcoming.
Current research on the communities of Milton Keynes, focusing on Health and Wellbeing; Poverty and Disadvantage; Work and Education.

The Bucks Data Exchange and Bucks LEP (Local Enterprise Partnership) recently shared the latest economic data at a cross-sector online event.

In hard economic times, how can businesses and charities build our collective resilience in Buckinghamshire?

Small Charity Week is all about empowering small charities across the UK, including highlighting the challenges they face and the positive impact they make on local communities. 96% of the voluntary organisations in the UK are small charities, with an annual income of less than £1million.

Wednesday Club Waddesdon are a sociable and supportive charity for older people in the North of Aylesbury Vale. They aim to improve mental health and reduce loneliness and isolation.
This dataset platform offers free statistics on …


