Residents safety concerns

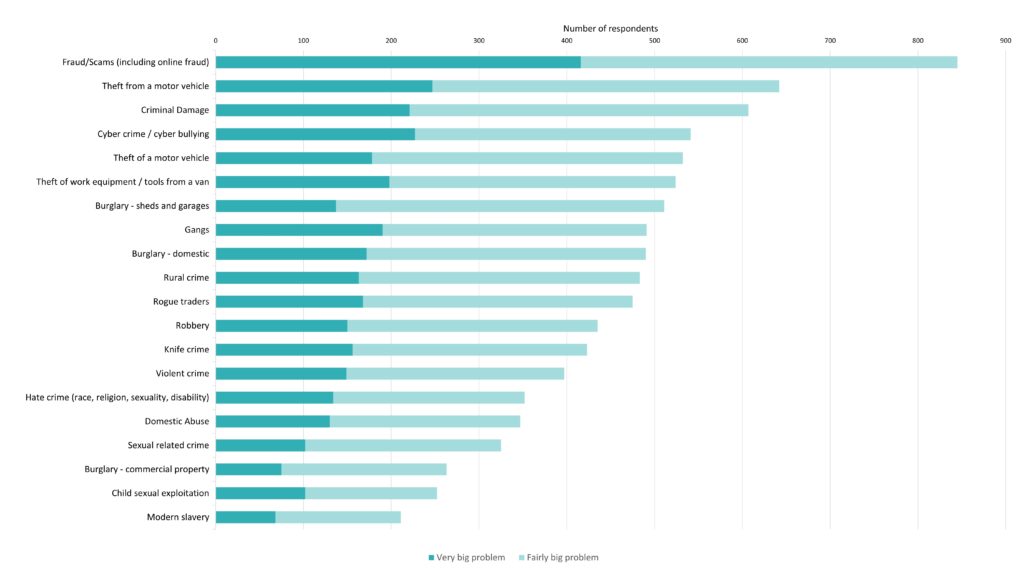
These charts show the issues that residents in Buckinghamshire are most concerned about in relation to crime and community safety.

Data in the charts below is taken from Buckinghamshire’s annual Residents Community Safety Survey which covers residents’ perceptions of crime and community safety concerns.


The most recent Buckinghamshire Residents Community Safety Survey was open for four weeks from 24th September to 22nd October 2021.  1,041 residents submitted a response to the survey. 

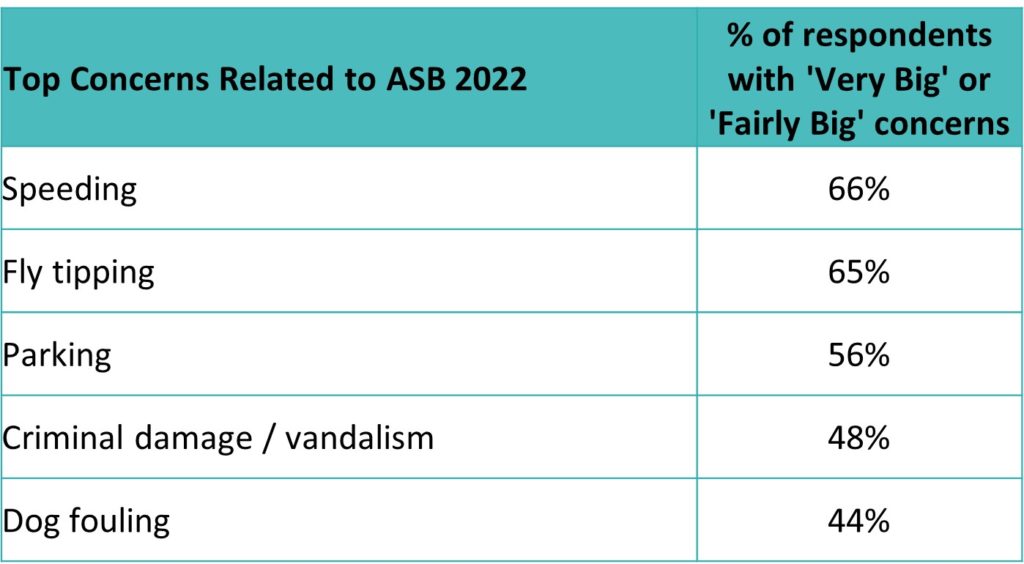
With regard to crime, the survey indicates that Buckinghamshire residents are most concerned about fraud and scams, as well as the theft of items from vans and motor vehicles. The issues that most concern residents with relation to anti-social behaviour are speeding, litter and fly tipping and parking.


The survey contains more information about concerns around drugs, feeling safe in the community and reporting concerns to the Police. More detail can be found via the source link at the top of the page. 

Residents' concerns about Crime
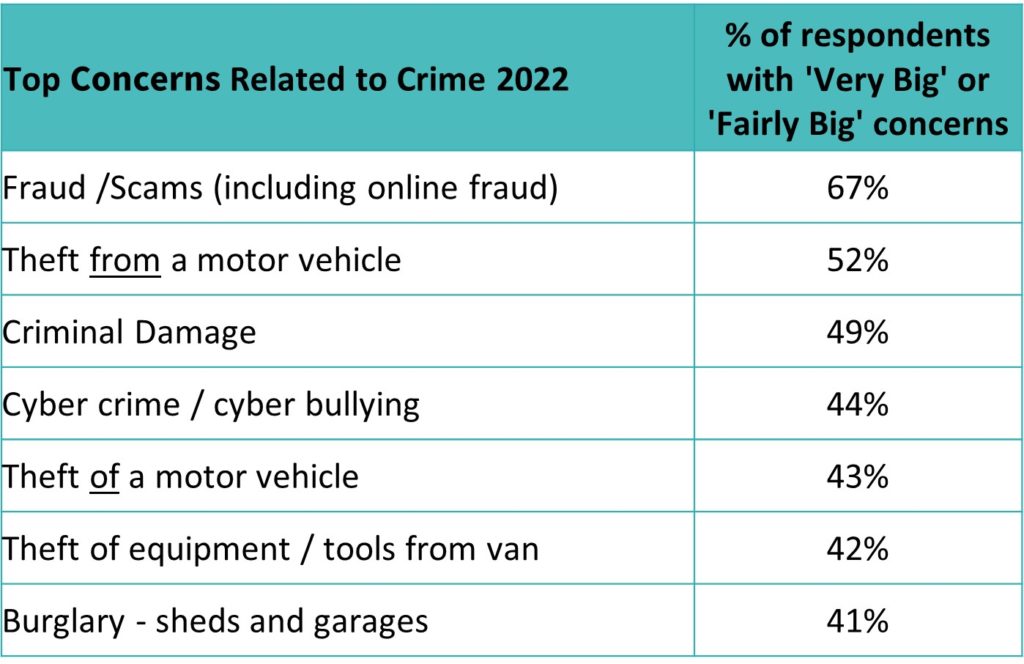
A table summarising the biggest concerns of residents in relation to Crime, and the percentage of respondents with that concern
Graph showing the number of respondents that have concerns relating to different categories of Crime

Residents concerns about anti-Social behaviour
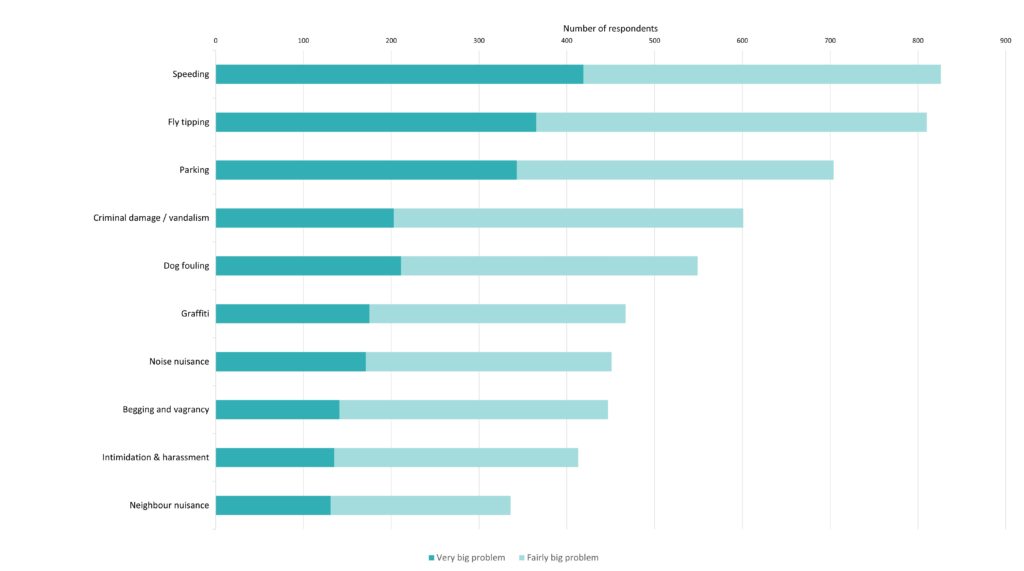
Graph showing the number of respondents that have concerns relating to different categories of Anti Social Behaviour
A table summarising the biggest concerns of residents in relation to Anti-Social Behaviour, and the percentage of respondents with that concern
Related Data
Image of the 2021 Census Logo
Data

2021 Census update

The census takes place every ten years. It gives a picture of all the people and households in England and Wales. The first 2021 Census

Read More »
Thumbnail of Buckinghamshire Population
Data

Population size

The chart shows the size of the population in Buckinghamshire and how it has changed since 1991 when the current recording methodology began.

Read More »
Population Age Composition
Data

Age distribution

The chart shows the age distribution of children (0-17 year-olds), working-age people (18-64 year-olds) and older people (65+ year-olds) in Buckinghamshire, South East England, and

Read More »
Data

Components of population change

The charts in this section show the components of population change. The components are natural change (births and deaths); internal UK migration (people moving in

Read More »
All Data