Data
Population of 0-17 year olds
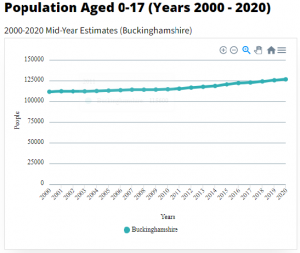
The data show how the population of children (aged 0-17) in Buckinghamshire has increased over the last two decades. The most recent decade between 2010 and 2020 has witnessed the largest increase.
The data show how the population of children (aged 0-17) in Buckinghamshire has increased over the last two decades. The most recent decade between 2010 and 2020 has witnessed the largest increase.
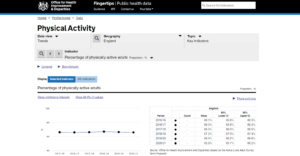
Fingertips is a large public health data collection, organised into themed profiles.
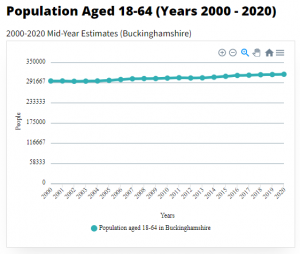
The data show how the working-age population (aged 18-64) in Buckinghamshire has changed over the last two decades and how it is projected to change over the coming two decades to 2040.
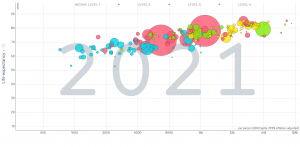
Animated ‘health (life expectancy) and wealth (income levels)’ population chart covering the world.
National and subnational mid-year population estimates for the UK and its constituent countries by administrative area, age and sex.
Population figures over a 25-year period (2018 projected to 2043) for local authorities in England
A downloadable Excel tool for interactive analysis of estimated population change for England and Wales.
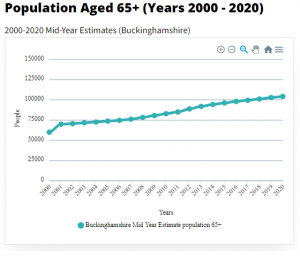
The charts show how the number of residents aged 65+ has increased over the last two decades and how it is predicted to continue to rise over the next two decades.
Buckinghamshire’s Economic Intelligence Observatory provides access to the latest economic data and insight in Buckinghamshire.

We hear from Leona Forsyth, Senior Grants Manager, at the Rothschild Foundation to hear more about how she uses data in her role and what motivates her to be involved in the BDEX.

This blog from James Moorhouse, Senior Research and Data Analyst at the Buckinghamshire Local Enterprise Partnership explains how recently released Census data has helped to uncover key differences in the labour market participation of residents and barriers to employment, across Buckinghamshire wards experiencing significant hardship.


