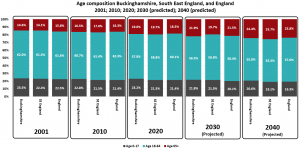
The working-age population in Buckinghamshire has increased from 296,800 people at the turn of the millennium to 316,200 people by 2020: a rise of 6.5%. According to the latest ONS projections, the number of people aged 18-64 in the county has reached a plateau and is predicted to stay within the 316,000-318,000 range for the foreseeable future.
In isolation, the projected lack of growth of the working-age population over the next two decades isn’t cause for concern. The issue however is that flatlining growth must be understood in the context of a rapidly ageing population. The population of 65+ year-olds by contrast is set to increase by some 35% over the next two decades. This will put a strain on people of working age either directly for people employed in caring roles or indirectly for those with older relatives.
Population Aged 18-64 (Years 2000 - 2020)
2000-2020 Mid-Year Estimates (Buckinghamshire)
No Data Found
Population Aged 18-64 (Years 2021 - 2040)
2021-2040 Projected population (Buckinghamshire)
No Data Found


