Life expectancy in Buckinghamshire
Life expectancy at birth provides the average number of years a person would expect to live based on current mortality rates.
In 2020-2022, the average life expectancy for men in Buckinghamshire was 81.0 years, and the average life expectancy for women was 84.5 years.
These charts also contain comparative data and show life expectancy in Buckinghamshire is higher than in the South East and England as a whole.
Life expectancy has been increasing in the last decade. However, since 2020 a gradual decrease has been seen due to the COVID-19 pandemic.
Female life expectancy
3 year average
No Data Found
Male life expectancy
3 year average
No Data Found
Healthy life expectancy
While life expectancy provides information on the average length of life, healthy life expectancy shows the average number of years a person can expect to live in good health based on current mortality rates and prevalence of self-reported good health.
The current healthy life expectancy in Buckinghamshire is 66.8 years for men and 68.6 years for women. These are significantly higher than England as a whole and similar to the South East.
On average, women’s life expectancy is higher than men’s in Buckinghamshire, however, both men and women have similar healthy life expectancy, indicating that women tend to live longer but in poorer health.
Another way of considering healthy life expectancy is to look at the average number of years that people live in poor health. Data from 2018-2020 suggests that men in Buckinghamshire live on average for 14.7 years in poorer health, which equates to 18% of average life expectancy and women live on average 16.5 years in poorer health, which equates to 19% of average life expectancy.
Female healthy life expectancy at birth
Male Healthy life expectancy at birth
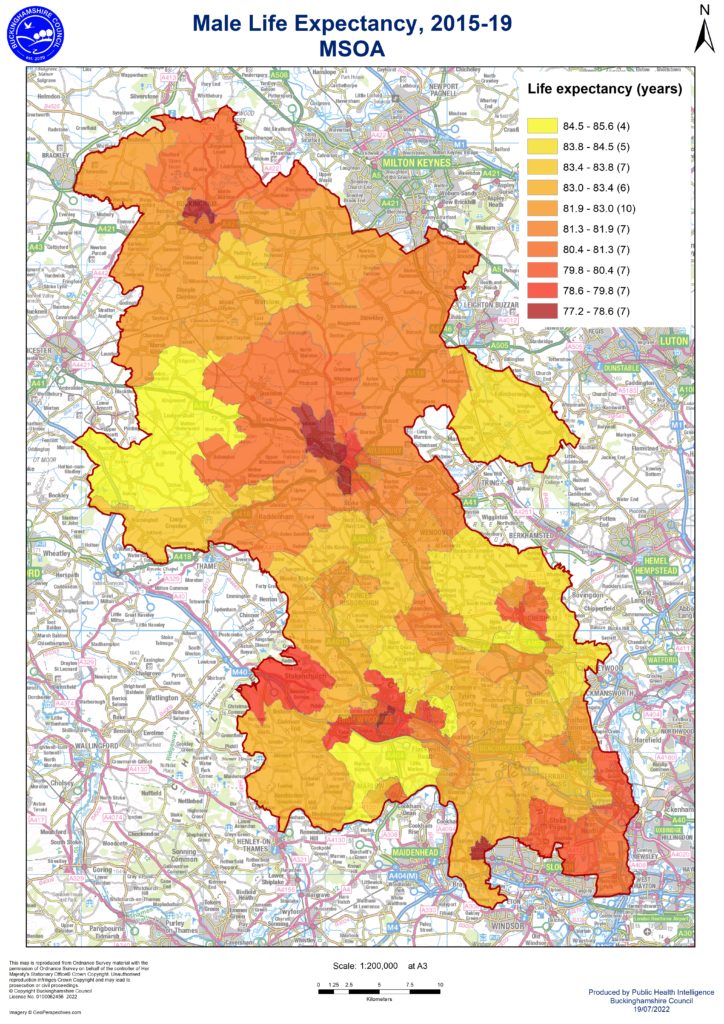
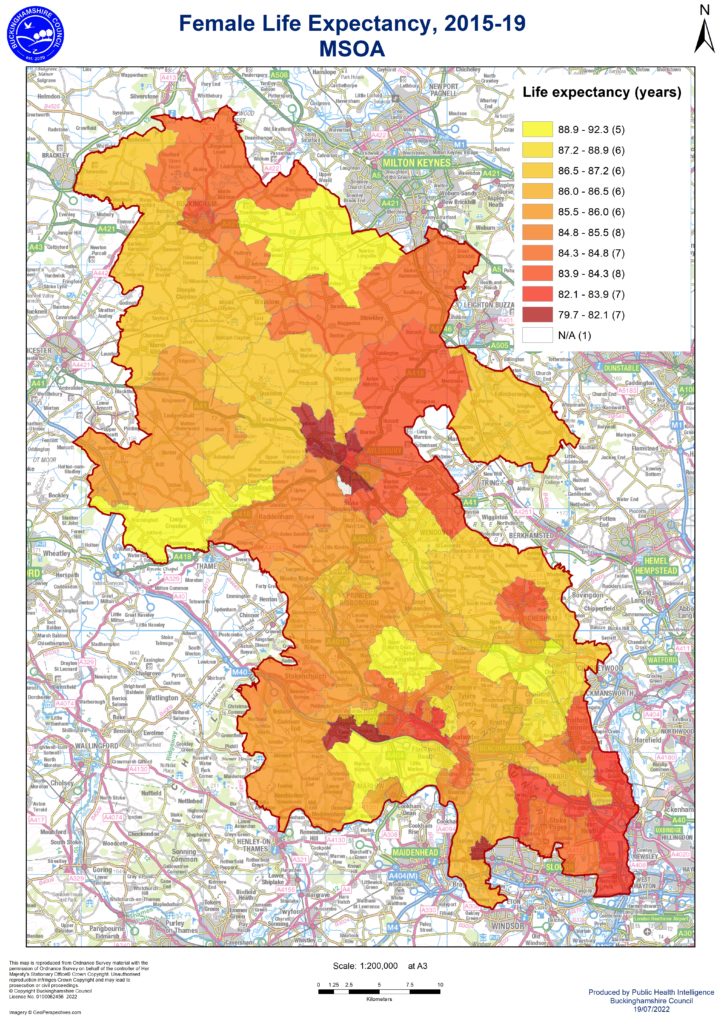
Life Expectancy by local area
These maps show the average life expectancy at birth for men and women in Buckinghamshire, by local area for 2015-19. The maps show there are areas of the county where people have longer life expectancies (which tend to be in more affluent areas) and lower life expectancies, which tend to be in more deprived urban areas such as Aylesbury and High Wycombe.
The difference between areas of high and low life expectancy is significant. For men, average life expectancy estimates for local areas vary between 77.2 years and 85.6 years. For women, average life expectancy estimates for local areas vary between 79.7 years and 92.3 years.
Life expectancy at birth for Males
by Middle Super Output Area (MSOA) (2015-2019)
Life Expectancy At Birth For Females
By Middle Super Output Area (MSOA) (2015-2019)