In Buckinghamshire in 2021, 79.9% of the population were from a White ethnic background compared to 81.0% in England and 86.3% in South East England. The largest ethnic minority group were Asian, Asian British or Asian Welsh. This group comprised 12.4% of the Buckinghamshire population compared to 9.6% in England and 7.0% in South East England. The county had a higher percentage of people with mixed ethnicity than South East England and England. There was also a higher percentage of Black, Black British, Black Welsh, Caribbean or African people in Buckinghamshire compared to the South East but not compared to England.
Data
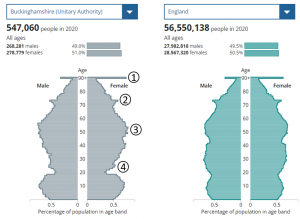
Population pyramid
A population pyramid shows the distribution of age and sex in a population by visualising the proportion of people that fall into each category.
Data
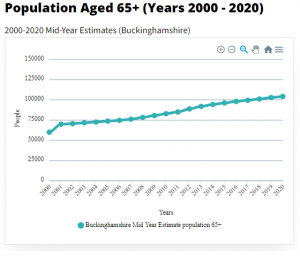
Population of 65+ year olds
The charts show how the number of residents aged 65+ has increased over the last two decades and how it is predicted to continue to
Data
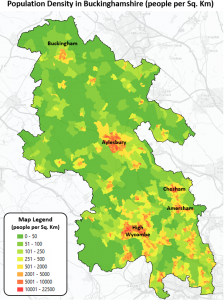
Population density
The choropleth (shaded) map shows population density in the county by census output areas. The red and orange areas have a high density of people

Data
Overweight and obese adults
This data shows the percentage of overweight and obese adults in Buckinghamshire, as well as comparative data from the South East and England.


