Search
Close this search box.

Greenhouse Gas Emissions

The Department for Energy Security and Net Zero publish national statistics on UK local authority and regional gas emissions. The greenhouse gases covered by these statistics are carbon dioxide, methane and nitrous oxide. In accordance with international reporting and carbon trading protocols, each of these gases is weighted by its global warming potential (GWP), so that total greenhouse gas emissions can be reported on a consistent basis (in carbon dioxide equivalent units). The GWP for each gas is defined as its warming influence relative to that of carbon dioxide. The GWPs used in these statistics are from Working Group 1 of the IPCC Fifth Assessment Report: Climate Change 2013.

Per Capita Emissions (t)

(Buckinghamshire, 2021)

5.3 tonnes

Buckinghamshire (5.3T) has per person greenhouse gas emissions (carbon dioxide, methane, and nitrous oxide) below the national average (6.9T). The total emissions by county can vary by a large degree to other counties, however the per person emissions tend to be closer. There are a range of factors which may influence the total carbon and per person emissions, such as the population of the area and how rural or urban it is in character.

Per Capital Greenhouse Gas Emissions (tonnes)

2005-2021

No Data Found

If you want to find out more about the Climate Change and Air Quality Strategy for Buckinghamshire, please see the Climate Change and Air Quality Strategy in our Resources section here.

Related Data
Discarded litter in a green meadow
Community Safety

Anti-Social Behaviour

This chart shows the number of recorded anti-social behaviour incidents in Buckinghamshire. Anti-social behaviour includes a range of nuisance and criminal behaviours which cause distress

Read More »
A set of house keys next to a small model house
Data

Average House Prices

Average house price for all sold properties, over the last 12 months. The Land Registry collects data on all housing transactions, published by individual property

Read More »
Data

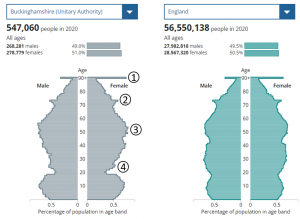
Population pyramid

A population pyramid shows the distribution of age and sex in a population by visualising the proportion of people that fall into each category.

Read More »
Street view of people walking fast
Data

Ethnicity

The data table shows ethnicity in Buckinghamshire from the 2021 Census. The county had a lower proportion of people from a white ethnic background than

Read More »