Search
Close this search box.

Population growth

The chart shows how Buckinghamshire’s population has increased (and decreased) year on year. It also shows the growth rate in South East England, England, and the UK.

Annual population growth rate helps determine the proportional increase or decrease in population from the previous year and is particularly helpful to compare growth rates with other areas. The chart shows how Buckinghamshire’s population has grown year on year from 1991 to 2020. It also shows the growth rate in South East England, England, and the UK overall. 

In all but one year (2002) the population in Buckinghamshire has grown annually for the last three decades. From the year 2012 onward, apart from 2017, the annual population growth rate in Buckinghamshire has been higher than the growth rate in South East England, England, and the UK. 

Population Growth

The annual % population growth rate in Bucks, SE England, and nationally

No Data Found

Related Data
Old person clasping their hands together
Data

Pension Credit Claimants

Pension Credit for residents aged 66 and over provides extra money to help with living costs for residents with low income. Pension Credit can help

Read More »
Data

Alcohol treatment

This data shows successful completions as a proportion of all in treatment. A successful completion means an alcohol user is free of alcohol dependence.

Read More »
Two old people sitting on a bench and looking at a mountain
Data

Old Age Dependency Ratio

The chart shows the historic and projected Old-Age Dependency Ratio (OADR) in Buckinghamshire. The OADR has risen steadily in the last two decades and is

Read More »
Population density map of Buckinghamshire
Data

Population density

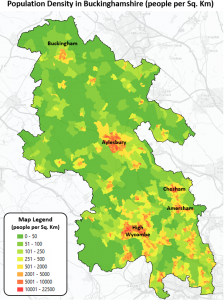
The choropleth (shaded) map shows population density in the county by census output areas. The red and orange areas have a high density of people

Read More »