Search
Close this search box.

Vehicle Crime

This chart shows the number of recorded vehicle crimes in Buckinghamshire. Vehicle crime includes the theft of a vehicle, theft from a vehicle and damage to a vehicle.

The chart below shows the number of recorded vehicle crimes in Buckinghamshire between 2019 and 2022.  


The benchmarks in the table on the right show the overall rate of recorded vehicle crime for 2021/22. The rate is the number of vehicle crimes reported per 1,000 people, enabling a meaningful comparison of vehicle crime in Buckinghamshire with other geographical areas.


These rates show that the rate of vehicle crime in Buckinghamshire increased in 2021/22 compared to 2020/21 and the rate of vehicle crime is higher in Buckinghamshire compared to the South East.

Vehicle crime rate calculated as 'number of vehicle offences per 1000 population'.

Vehicle crime

Monthly reported vehicle crime in Buckinghamshire, 2019-22

No Data Found

Related Data
Value of grants given in Buckinghamshire
Charities & Funding

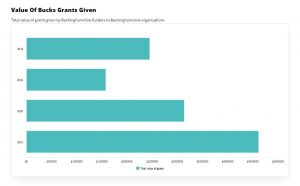
Value of Bucks grants given

This chart contains the total value of grants awarded by some of the key funders in Buckinghamshire, to Buckinghamshire based organisations. It shows how much

Read More »
Person holding a briefcase
Charities & Funding

Charity delivery approach

This data shows the different methods of operation that registered charities in Buckinghamshire undertake. Charities can use a range of methods to deliver support to

Read More »
Pile of pound coins
Data

Top job postings

Tables showing top occupations by number of job postings for 2022 in Buckinghamshire, the South East and England.

Read More »
Street view of people walking fast
Data

Ethnicity

The data table shows ethnicity in Buckinghamshire from the 2021 Census. The county had a lower proportion of people from a white ethnic background than

Read More »