Search
Close this search box.

Drug Crime

This chart shows the number of recorded drug crimes in Buckinghamshire. Drug crime is a crime type that includes possession of a controlled drug, possession with intent to supply, supply of a controlled drug and production of a controlled drug.

This chart below shows the monthly number of recorded drug crimes in Buckinghamshire between 2019 and 2022.


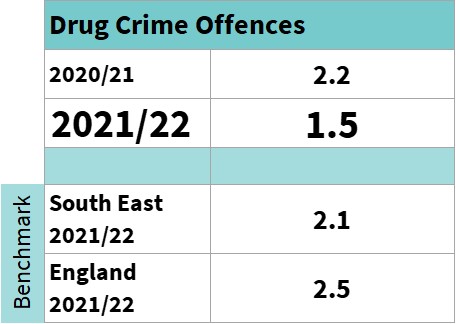
The benchmark table shows the overall drug crime rate for 2021/22 as well as the rate for 2020/21. The rate is the number of drug crimes reported per 1,000 people, enabling a meaningful comparison of drug crime in Buckinghamshire with other geographical areas.


This data shows that Buckinghamshire’s drug crime rate has decreased slightly  compared to 2020/21, and that the rate is lower in Buckinghamshire compared to both the South East and England.


Drug crime rate calculated as 'number of drug offences per 1000 population'.

Drug Offences

Monthly drug offences in Buckinghamshire, 2019-22

No Data Found

Related Data
Data

Population pyramid

A population pyramid shows the distribution of age and sex in a population by visualising the proportion of people that fall into each category.

Read More »
Cars parked in a row
Community Safety

Vehicle Crime

This chart shows the number of recorded vehicle crimes in Buckinghamshire. Vehicle crime includes the theft of a vehicle, theft from a vehicle and damage

Read More »
Value of grants given in Buckinghamshire
Charities & Funding

Number of Bucks grants given

This chart shows the total number of grants given by some of the key charitable funders in Buckinghamshire to Buckinghamshire based organisations. It gives an

Read More »
Two old people sitting on a bench and looking at a mountain
Data

Life expectancy

This data includes charts showing the life expectancy of men and women in Buckinghamshire, healthy life expectancy, as well as maps showing how life expectancy

Read More »