Search
Close this search box.

Anti-Social Behaviour

This chart shows the number of recorded anti-social behaviour incidents in Buckinghamshire. Anti-social behaviour includes a range of nuisance and criminal behaviours which cause distress to other individuals or communities, or impact the wider environment.

This chart shows the number of anti-social behaviour incidents recorded in Buckinghamshire each month between 2019 and 2022. The data in the chart shows that there have been higher levels of anti-social behaviour recorded in summer months. This pattern is consistent with patterns nationally.


The table shows the anti-social behaviour rates for 2021-22 compared to the previous year, as well as regional and national benchmark rates. The rate is the number of incidents reported per 1,000 households, enabling a meaningful comparison of anti-social behaviour rates in Buckinghamshire with other geographical areas.


The table shows that Buckinghamshire’s anti-social behaviour rate was lower in 2021-22 compared to 2020-21, and is significantly lower than the South East and England.


It is worth noting that whether a person’s actions can be classed as anti-social behaviour relies heavily on the impact it has on other people as well as the type, frequency and intensity of that behaviour. 
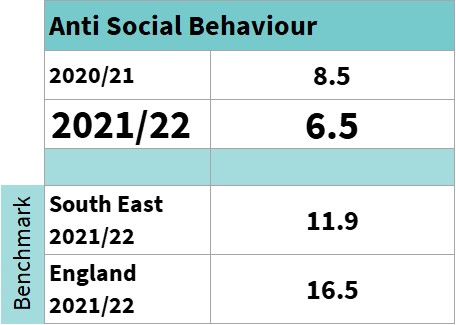
Anti-Social Behaviours incident rates calculated as 'number of ASB incidents per 1,000 population'.

Anti-Social Behaviour

Monthly Anti-Social Behaviour incidents in Buckinghamshire, 2019-22

No Data Found

Related Data
Data

Alcohol treatment

This data shows successful completions as a proportion of all in treatment. A successful completion means an alcohol user is free of alcohol dependence.

Read More »
three gas oven hobs which are on
Data

Households in Fuel Poverty

Fuel poverty in England is measured using the Low Income Low Energy Efficiency (LILEE) indicator. Under this indicator, a household is considered to be fuel

Read More »
three gas oven hobs which are on
Data

Greenhouse Gas Emissions

The Department for Energy Security and Net Zero publish national statistics on UK local authority and regional gas emissions. The greenhouse gases covered by these

Read More »
Children at a sports day
Data

Physically active children

This data shows the percentage of children aged 5 to 16 who take part in at least 60 minutes physical activity each day across a

Read More »