Search
Close this search box.

Population density

The choropleth (shaded) map shows population density in the county by census output areas. The red and orange areas have a high density of people per square kilometre. The green areas are sparsely populated with the lowest density of people per square kilometre.

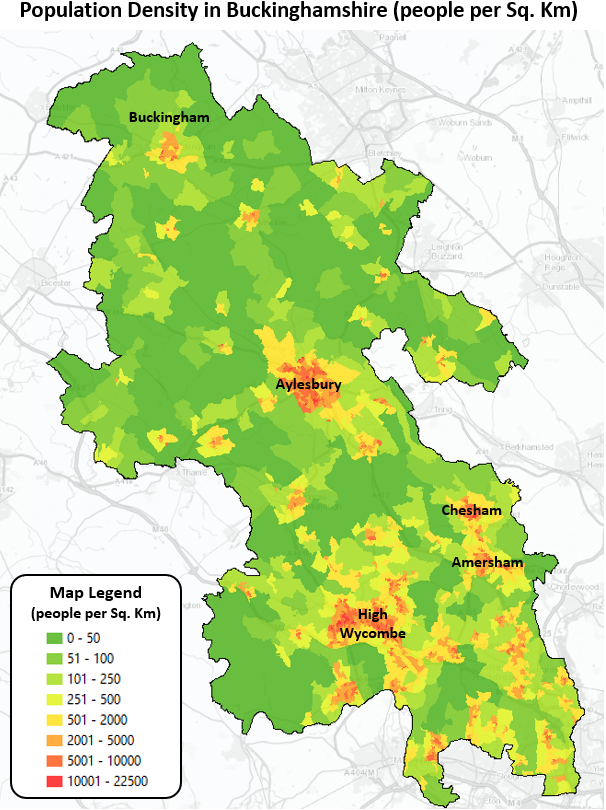
The south of the county of Buckinghamshire has a higher population density than the north. The settlements of Chesham, Amersham, Gerrards Cross, Beaconsfield, High Wycombe, and Marlow contribute to a greater number of people per square kilometre. The north of the county is more rural with a higher proportion of farmland and fewer large settlements. 

The maps below show population densities using Census output area boundaries which are the smallest and most detailed boundary data that the Office of National Statistics (ONS) provide. 

Population density map of Buckinghamshire

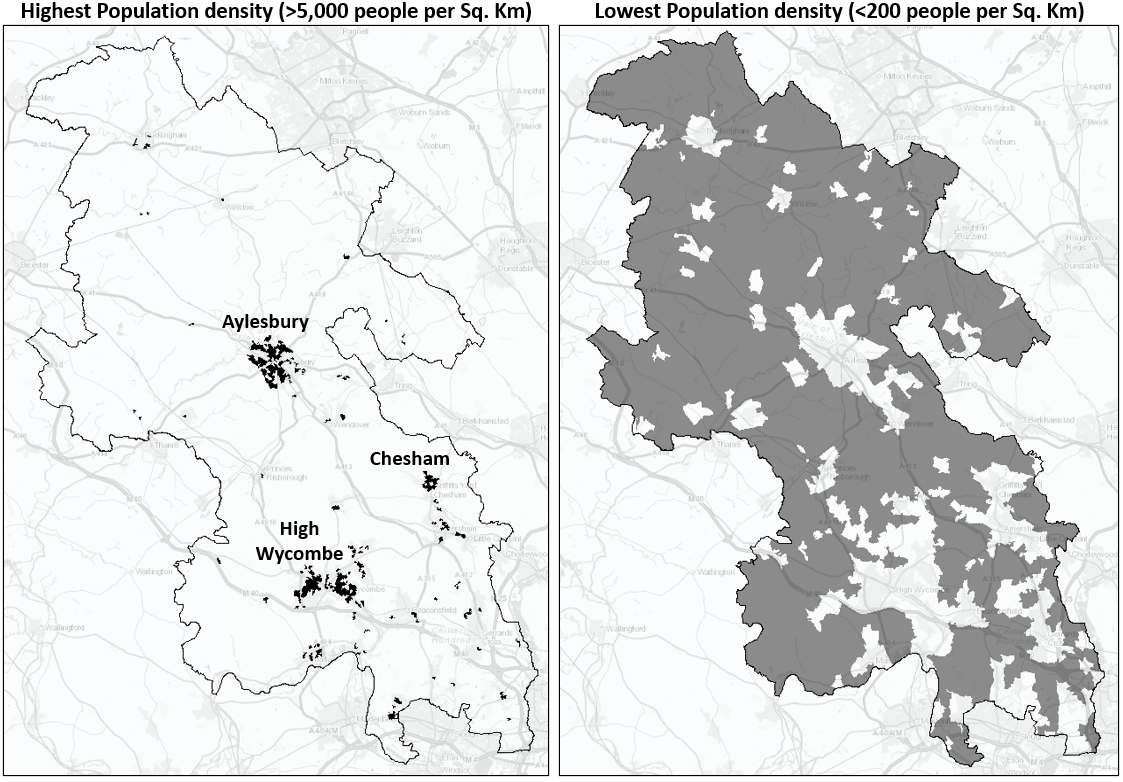
These two maps show which areas in Buckinghamshire have the highest densities of people (more than 5,000 per square kilometre) and the lowest densities (less than 200 people per square kilometre). 

The maps illustrate how urban settlements have areas of high-density housing whereas large swathes of rural areas in Buckinghamshire have relatively few dwellings and people. 

Highest and Lowest population Densities map of Bucks
Related Data
Cars parked in a row
Community Safety

Vehicle Crime

This chart shows the number of recorded vehicle crimes in Buckinghamshire Vehicle crime includes the theft of a vehicle theft from a vehicle and damage

Read More »
Black and white images of a blurred adult figure with their palm outstretched to the camera. Fearful / defensive pose
Community Safety

Domestic Abuse

This data shows the number of recent incidents attended by Thames Valley Police which have been flagged as being related to domestic abuse in Buckinghamshire

Read More »