Population density
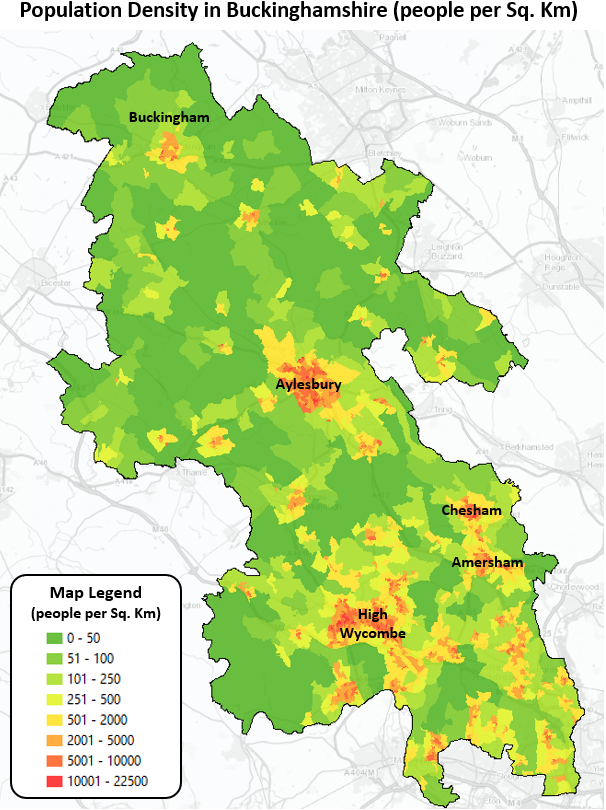
The choropleth (shaded) map shows population density in the county by census output areas. The red and orange areas have a high density of people per square kilometre. The green areas are sparsely populated with the lowest density of people per square kilometre.


