Search
Close this search box.

Indices of Multiple Deprivation (2019)

The Indices of Multiple Deprivation (IMD) is calculated by the Department for Levelling Up, Housing and Communities (DLUHC) and provides a relative measure of deprivation for small areas across England. The IMD combines data from 38 different indicators across seven broad ‘domains’ reflecting the multiple issues many deprived households face. The IMD ranks all 32,844 Lower Super Outputs Areas (LSOAs) in England against each other on the basis of their levels of relative deprivation or ‘scores’. The latest iteration of this data was published in 2019 utilising data which was sourced in 2016.

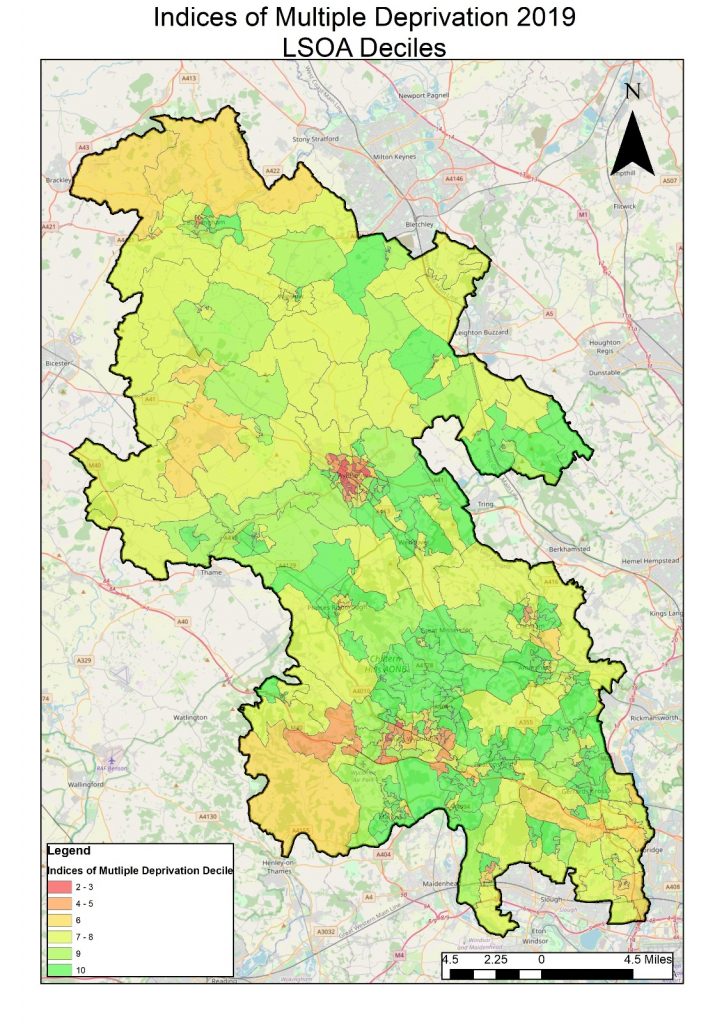
This indicator outlines the ‘smaller’ boundaries within Buckinghamshire which are deprived across a range of factors beyond low income. The IMD is also relative to the rest of England so it’s powerful in highlighting key areas of deprivation within Buckinghamshire, which is typically seen as an affluent county. The map shows pockets of deprivation in Aylesbury and High Wycombe.


At aggregate level, Buckinghamshire’s deprivation levels are low. With a 2019 Index of Multiple Deprivation (IMD) deprivation score of 10.1, Buckinghamshire is deemed the least deprived LEP area in England. This compares to a score of 15.5 for the South East and 21.8 for England.

7 domains of deprivation

Percentage weighting of data into the indices ranking


  • Income – 22.5%
  • Employment – 22.5%
  • Education – 13.5%
  • Health – 13.5%
  • Crime – 9.3%
  • Barriers to Housing & Services – 9.3%
  • Living Environment – 9.3%
Related Data
Red front door
Community Safety

Doorstep Crime

This chart shows the number of Trading Standards interventions involving doorstep crime, typically cold callers to victims’ front doors.

Read More »
Old person clasping their hands together
Data

Pension Credit Claimants

Pension Credit for residents aged 66 and over provides extra money to help with living costs for residents with low income. Pension Credit can help

Read More »
Population density map of Buckinghamshire
Data

Population density

The choropleth (shaded) map shows population density in the county by census output areas. The red and orange areas have a high density of people

Read More »
Red telephone handset
Community Safety

Nuisance calls blocked

This chart shows the number of recent nuisance calls blocked in Buckinghamshire using a blocker device. These devices are issued by Trading Standards to vulnerable

Read More »