Search
Close this search box.

Households in Fuel Poverty

Fuel poverty in England is measured using the Low Income Low Energy Efficiency (LILEE) indicator. Under this indicator, a household is considered to be fuel poor if they are living in a property with a fuel poverty energy efficiency rating of band D or below, and when they spend the required amount to heat their home they are left with a residual income below the official poverty line. There are 3 important elements in determining whether a household is fuel poor: household income, household energy requirements and fuel prices

Fuel poverty is an important dimension of financial insecurity as it measures both household energy efficiency and low income to outline which areas in the county might be more susceptible to rises in energy prices. The Department for Business, Energy and Industrial Strategy (DBEIS)  produces data to estimate the number of households in Fuel Poverty.


The definition of fuel poverty is based on the Low Income High Costs framework, where a household is in fuel poverty if their required fuel costs are above the national median average and, were they to spend that amount, they would be left with an income below the official poverty line. 


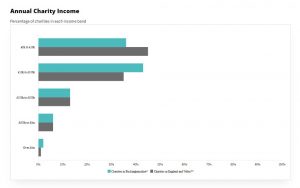
The benchmarks in the graph suggest that the percentage of households in fuel poverty in Buckinghamshire is lower than the percentage in the South East (8.6%), but that there are areas in Buckinghamshire which experience higher levels of fuel poverty. 


Percentage of Buckinghamshire households in fuel poverty (2020)


 7.3%

Households in Fuel Poverty

Percentage of households in fuel poverty as of 2020 (published 2022) Ward Areas

No Data Found

Related Data
A row of modern houses taken from the back, looking across their back gardens
Community Safety

Burglary

This chart shows the number of recorded burglary offences in Buckinghamshire. Burglary is the illegal entering of a building in order to commit a crime,

Read More »
Children at a sports day
Data

Physically active children

This data shows the percentage of children aged 5 to 16 who take part in at least 60 minutes physical activity each day across a

Read More »
Annual distribution of income of Buckinghamshire and national charities
Charities & Funding

Annual charity income

This chart shows how the annual income of charities is distributed according to a range of income bands, giving an indicator of the size of

Read More »