
Data
Unemployment and economic inactivity
Data on the number of Buckinghamshire residents who are unemployment, economically inactive and claiming out-of-work / underemployment related benefits.
Data
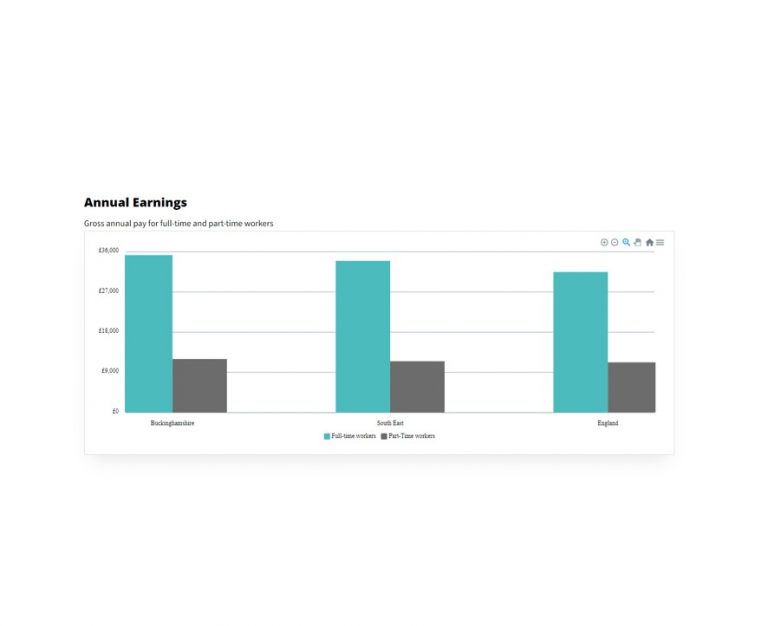
Annual earnings
The graph shows the median gross annual pay for residents working full-time and part-time in Buckinghamshire, the South East, and England.
Data
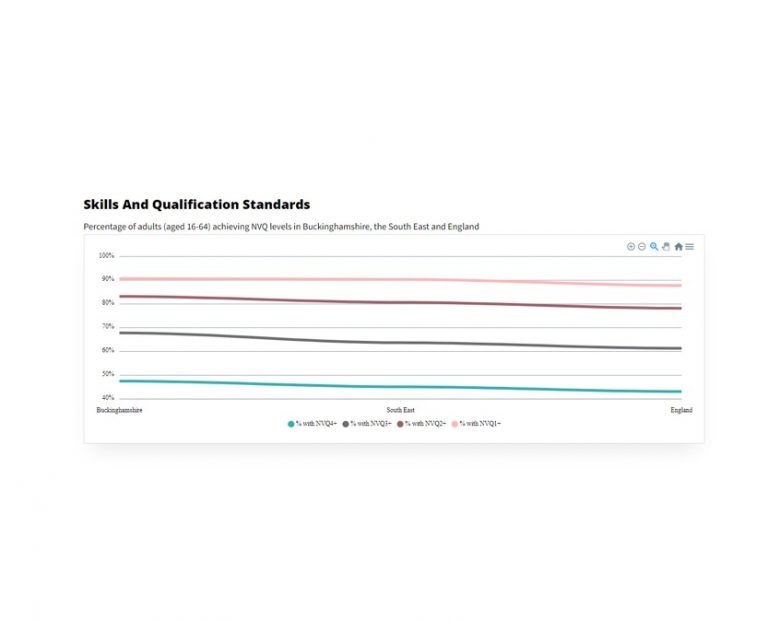
Highest Level of Qualification Held
Table showing the proportion of working age (16-64) residents by the highest level qualification they have in Buckinghamshire, the South East and England.

Data
Top job postings
Tables showing top occupations by number of job postings in 2023 for Buckinghamshire, the South East and England.
Data
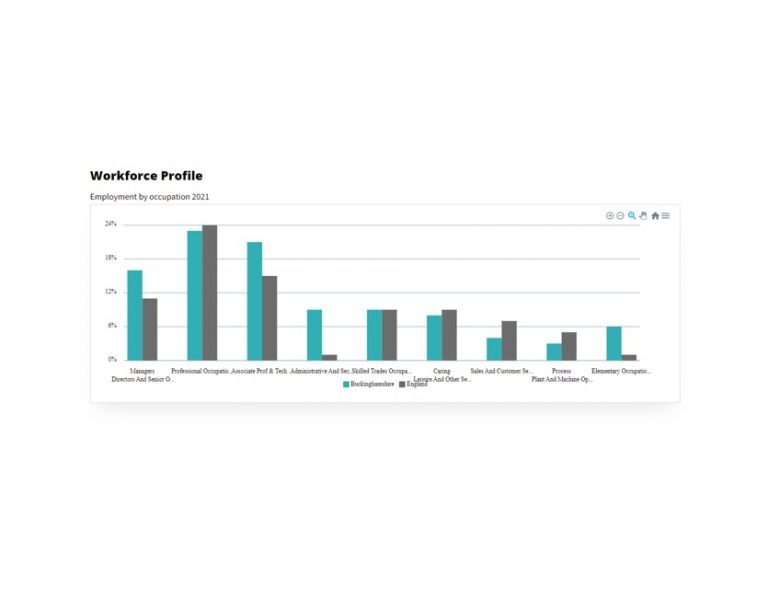
Occupational profile
This chart shows how the broad occupational profile of Buckinghamshire’s residents compares with the occupational profile of England as a whole.


