Greenhouse Gas Emissions
The Department for Energy Security and Net Zero publish national statistics on UK local authority and regional gas emissions. The greenhouse gases covered by these statistics are carbon dioxide, methane and nitrous oxide. In accordance with international reporting and carbon trading protocols, each of these gases is weighted by its global warming potential (GWP), so that total greenhouse gas emissions can be reported on a consistent basis (in carbon dioxide equivalent units). The GWP for each gas is defined as its warming influence relative to that of carbon dioxide. The GWPs used in these statistics are from Working Group 1 of the IPCC Fifth Assessment Report: Climate Change 2013.

Broadband Speed
Broadband provides access to internet services such as videoconferencing for work, tele-healthcare, access to job or property advertisements, and e-commerce. It is fast becoming an essential utility alongside water, gas and electric in UK homes. From March 2018, the Government set a legal minimum service obligation (LSO) of 10 megabytes per second (Mbps). Ofcom research shows that 10 Mbps is the minimum speed currently needed to meet an average household’s digital needs. It should be fast enough for multiple people in a household to be online at once.

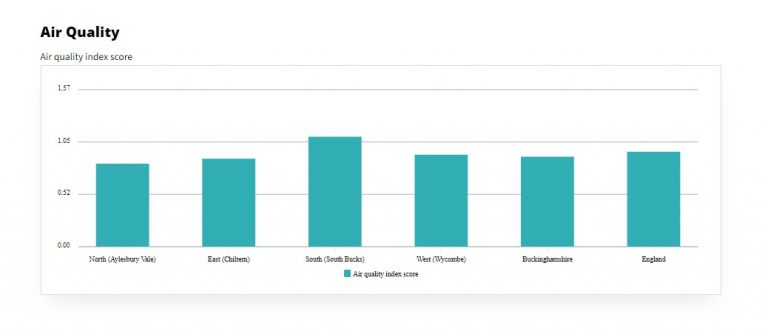
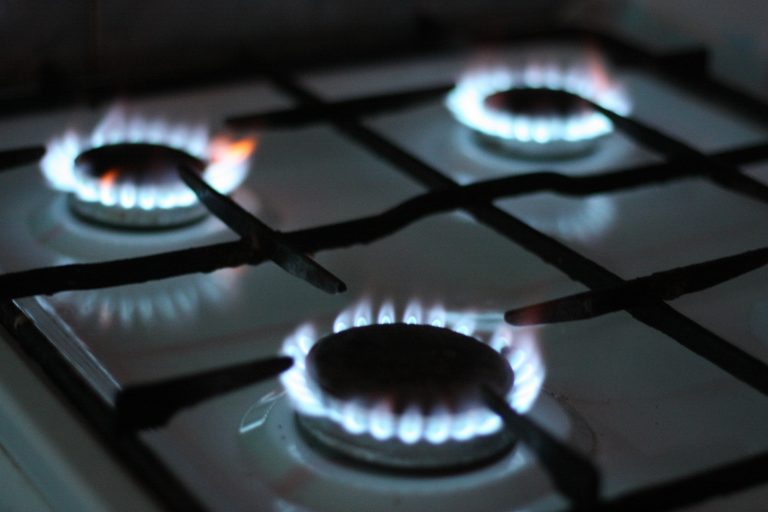
Air quality
Air quality can be assessed by the concentration of various pollutants in the air. The air quality indicator is compiled from four key air pollutants: Nitrogen dioxide, Benzene, Sulphur dioxide, and Particulates.
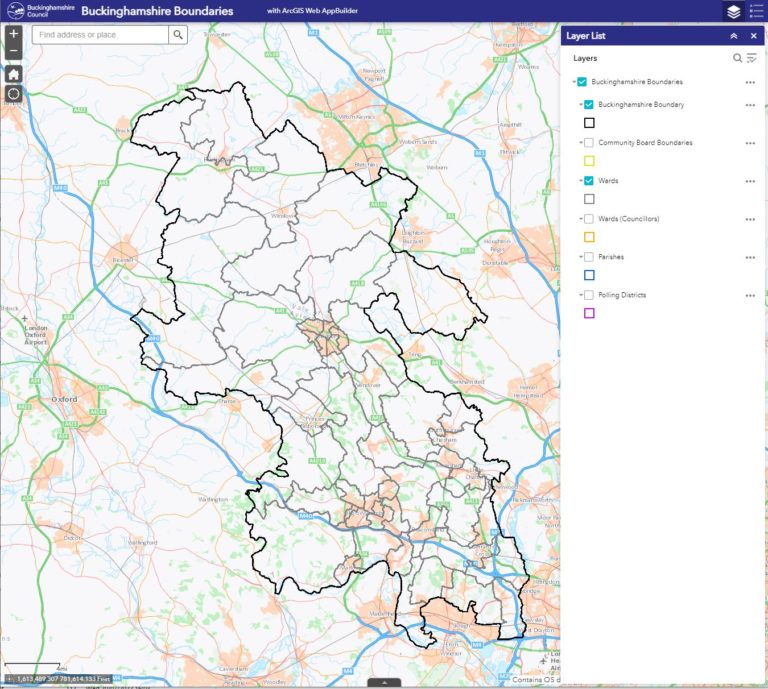
Map of Buckinghamshire
A boundary map is a map created for the purpose of outlining a boundary for an area and the areas next to it.


