Cost of Living: Vulnerable Households
This dataset captures the relative risk of households falling below an acceptable standard of living as a result of rising costs. The indicator is presented as a score with a higher score indicating higher vulnerability. The cost of living is calculated using the 2021 Minimum Income Standard (MIS) developed at Loughborough University’s Centre for Research in Social Policy (CRSP). The Minimum Income Standard (MIS) presents a vision of the living standards that we, as a society, consider everyone in the UK should be able to achieve, based on what members of the public think we all need for an acceptable minimum standard of living.
Largest charities

This table provides information on the 20 largest registered charities operating in Buckinghamshire. It contains their latest reported annual income, a link to their website and the number of staff and volunteers they have.
Charity delivery approach

This data shows the different methods of operation that registered charities in Buckinghamshire undertake. Charities can use a range of methods to deliver support to their beneficiaries and this chart does not necessarily reflect all the different types of work that charities do.
Energy efficiency of domestic buildings

Energy efficiency is a key contributing factor of fuel poverty because properties with poor energy efficiency are likely to have costly fuel bills. The data is derived from postcode level Energy Performance Certificates (EPC) for domestic buildings. Data has been calculated by averaging (mean) the median energy efficiencies of local areas and the source of the data is the Department for Levelling Up, Housing and Communities.
Charity beneficiaries

This chart shows the groups of people that charities in Buckinghamshire seek to support. Charities can benefit many different groups of people and this chart does not necessarily reflect all the groups that charities work with.
Geographic Local Charity Focus
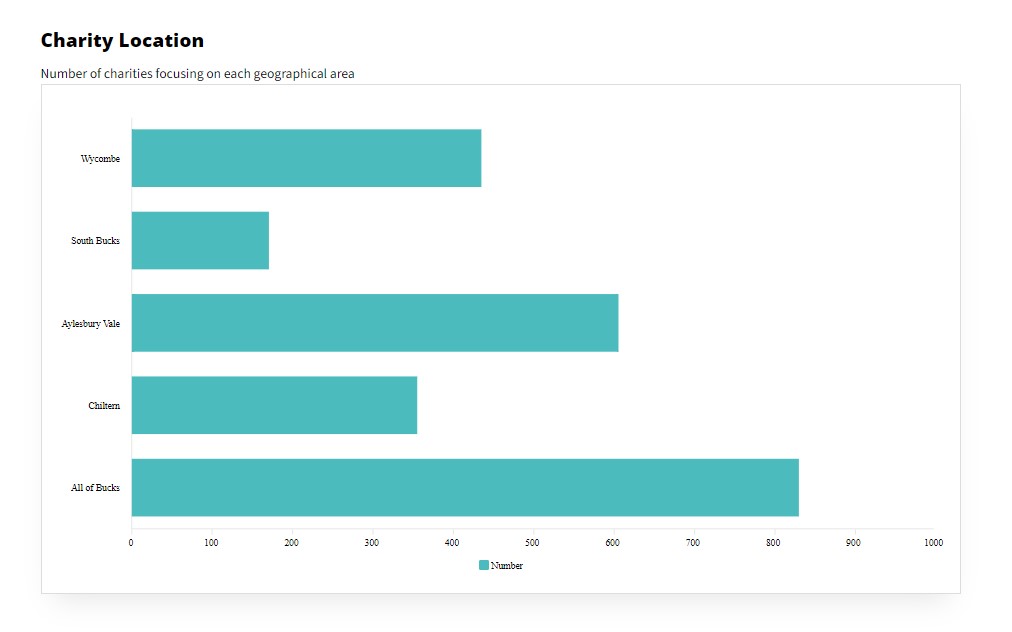
This chart shows where charities that benefit a specified local area in Buckinghamshire are based. Some registered charities, particularly smaller ones, have a local focus and specify the area that they seek to support, while other Buckinghamshire based charities operate nationally or internationally. Charities with a national and international focus are not included in this dataset.
Average House Prices

Average house price for all sold properties, over the last 12 months. The Land Registry collects data on all housing transactions, published by individual property and date. Community Insight presents this for your neighbourhoods, averaged over a 12-month period. The (N) figure in the data table is the total value of property transactions over the 12 month period (in £1,000s).
Indices of Multiple Deprivation (2019)

The Indices of Multiple Deprivation (IMD) is calculated by the Department for Levelling Up, Housing and Communities (DLUHC) and provides a relative measure of deprivation for small areas across England. The IMD combines data from 38 different indicators across seven broad ‘domains’ reflecting the multiple issues many deprived households face. The IMD ranks all 32,844 Lower Super Outputs Areas (LSOAs) in England against each other on the basis of their levels of relative deprivation or ‘scores’. The latest iteration of this data was published in 2019 utilising data which was sourced in 2016.
Households in Fuel Poverty
Fuel poverty in England is measured using the Low Income Low Energy Efficiency (LILEE) indicator. Under this indicator, a household is considered to be fuel poor if they are living in a property with a fuel poverty energy efficiency rating of band D or below, and when they spend the required amount to heat their home they are left with a residual income below the official poverty line. There are 3 important elements in determining whether a household is fuel poor: household income, household energy requirements and fuel prices
Children in absolute low-income families

A household must have claimed Child Benefit and at least one other household benefit (Universal Credit, tax credits or Housing Benefit) at any point in the year to be classed as low income in these statistics. These figures will present a percentage of all children (aged 0-19) who live in one of these households. Absolute low income measures families in low income based on what low income looked like in financial year ending 2011. Income is Before Housing Costs (BHC) and is equivalised to adjust for family size and composition.


